
Surf Forecasts:

Fenway Beach surf forecast from 3 Aug 2026:
- Best quality surf: Monday 3 Aug, 11PM (local time) - 6ft (1.9m), 9s period, S swell with cross-offshore winds.
- Most powerful swell: Monday 3 Aug, 8PM (local time) - 8ft (2.5m), 9s period, S swell with 963 kJ wave energy.
- Next surfable swell (1★+): Monday 3 Aug, 11PM (local time) - 6ft (1.9m), 9s period with S swell.
Best Forecast Surf Conditions for Fenway Beach this week:
The surf forecast for Fenway Beach over the next 16 days: The first swell (rated 1 star or higher) is forecast to arrive on Monday (Aug 03) at 11PM. The primary swell is predicted to be 1.9m and 9s period. The wind is predicted to be cross-offshore as the swell arrives.
The most powerful waves expected at Fenway Beach in the next 16 days are 2.5m 9s and forecast to arrive on Monday (Aug 03) at 8PM. Winds are predicted to be cross-shore at the time the swell arrives. The largest open ocean swell (not directed at the beach) is 0.3m 3s period and expected on Tuesday (Aug 04) at 2AM.
| Wave Type | Time (EDT) & Date | Wave Height & Period |
|---|---|---|
| Next good surf (1 star+) | 11PM (Mon 3rd Aug) | 6ft (1.9m) 9s |
| Best Surf | 11PM (Mon 3rd Aug) | 6ft (1.9m) 9s |
| Most Powerful | 8PM (Mon 3rd Aug) | 8ft (2.5m) 9s |
Table - best surf conditions forecast for Fenway Beach over the next 16 days.
The Lowdown
Right off the bat, I gotta level with you. The next couple of weeks are looking pretty bleak. We’ve got a long stretch of poor surf ahead, and honestly, for the first while, there’s not a single session I’d recommend paddling out for. We’re looking at a solid run of small, junky, wind-blown conditions that just aren’t gonna give you anything to work with.
The swell windows are mostly short-period windswell, and the energy is just limp. We start things off Monday with a bit of a pulse – about 8ft from the south, but it’s coming in at a short 8 seconds and the wind is howling onshore. The combined energy is moderate at 771, but it’s messy, and the water’s a bit colder than usual for this time of year, sitting at 69°. That’s about 3° off the norm, so it’s noticeable but not crazy. Don’t get too excited, though – that’s about as good as it gets for a while.
From there, it’s a slow grind downhill. The size drops right off. Tuesday through to the weekend, we’re mostly looking at ankle-to-knee high slop, with periods dropping to 6-7 seconds. Wind’s gonna be a constant problem too, with a bunch of cross-onshore junk. It’s going to be bumpy and lumpy, with very little combo of size and clean conditions. There’s a brief moment Tuesday afternoon where the wind goes straight onshore but it’s only 3ft of weak, short-period stuff. That’s a hard pass.
We finally get a bit of relief around the 11th and into the 13th, with some cleaner conditions as the wind backs off or goes cross-offshore. A couple of mornings will be glassy. But the swell is just tiny – under 3ft. It’s rideable on a longboard, but there’s not much push, and the energy is barely registering. The 14th and 15th give us a little more hope with some light offshore or even glassy mornings, but again, we’re dealing with 2ft to 2ft of swell with short periods. It’s clean, but it’s not surf.
The 16th has a clean, moderate offshore, but the swell is down to 1ft. And the 17th? A tiny 0.7ft with a long 9-second period shows up, but it’s a whisper. The final day, the 18th, sees a slight bump back up to 3ft, but the wind goes straight onshore again and wrecks it.
So, here’s the deal: there is nothing worth getting excited about in this entire 16-day window. If you’re desperate, the glassy mornings mid-period might get you out on a longboard for a splash, but you’re not going to be riding any waves of consequence. This is a dull, flat spell and Fenway Beach is looking pretty sad. Usually, it’s fairly consistent, so this kind of dead run isn’t the norm, and the forecasts can change. But for now, my honest advice is to find something else to do.
Rusty
Short Range ForecastHeavy rain (total 21mm), heaviest during Mon afternoon. Warm (max 26°C on Tue afternoon, min 19°C on Mon night). Winds decreasing (fresh winds from the SSW on Mon morning, calm by Tue night). | Days 4-6 Weather SummaryLight rain (total 6mm), mostly falling on Sat night. Warm (max 30°C on Fri afternoon, min 24°C on Thu morning). Wind will be generally light. | ||||||||||||||||||||
Monday 3 | Tuesday 4 | Wednesday 5 | Thursday 6 | Friday 7 | Saturday 8 | Sunday 9 | |||||||||||||||
AM | PM | Night | AM | PM | Night | AM | PM | Night | AM | PM | Night | AM | PM | Night | AM | PM | Night | AM | PM | Night | |
Swell Height Map | 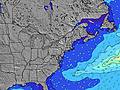 | 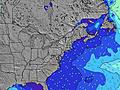 | 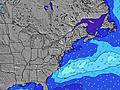 | 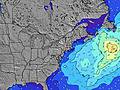 | 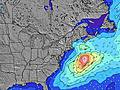 | 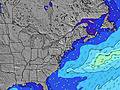 | 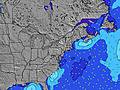 | ||||||||||||||
Wave Height (m) Direction Period (s) | S 8 | S 9 | S 9 | S 8 | S 8 | S 7 | SSE 8 | SSE 7 | S 6 | S 6 | S 6 | SSW 6 | SSW 6 | SSW 6 | SSW 6 | S 6 | S 6 | SSW 6 | SSW 6 | SSW 6 | SSW 6 |
Wave Graph | |||||||||||||||||||||
724 | 835 | 419 | 182 | 74 | 52 | 173 | 82 | 21 | 59 | 89 | 139 | 64 | 68 | 58 | 24 | 24 | 28 | 36 | 48 | 62 | |
Wind (km/h) | |||||||||||||||||||||
Wind State on-shore cross-onshore cross-shore cross-offshore off-shore glassy | on | cross-on | cross-off | cross | on | cross-off | cross-off | cross-on | cross | cross-on | cross-on | cross-on | cross-on | cross-on | cross-on | cross | cross-on | cross-on | cross-on | cross-on | cross-on |
High Tide | 12:03PM0.85m | 00:09AM0.76m | 12:52PM0.87m | 00:59AM0.71m | 1:54PM0.87m | 2:06AM0.67m | 3:08PM0.89m | 3:25AM0.65m | 4:16PM0.91m | 4:36AM0.66m | 5:22PM0.95m | 5:47AM0.69m | 6:26PM0.98m | ||||||||
Low Tide | 6:02PM0.09m | 6:06AM-0.01m | 7:00PM0.11m | 6:52AM0.01m | 8:30PM0.13m | 7:57AM0.03m | 9:50PM0.12m | 9:28AM0.03m | 10:57PM0.09m | 10:42AM0.02m | 00:03AM0.05m | 11:53AM-0.01m | 1:02AM-0.00m | ||||||||
5:43 | — | — | 5:45 | — | — | 5:46 | — | — | 5:47 | — | — | 5:48 | — | — | 5:48 | — | — | 5:50 | — | — | |
— | 8:00 | — | — | 8:00 | — | — | 7:59 | — | — | 7:58 | — | — | 7:55 | — | — | 7:54 | — | — | 7:53 | — | |
mm | 5 | 13 | 3 | — | — | — | — | — | — | — | — | — | — | — | — | — | — | 6 | — | — | — |
Temp °C | 24 | 23 | 24 | 24 | 26 | 23 | 25 | 26 | 24 | 27 | 28 | 25 | 28 | 30 | 28 | 28 | 30 | 27 | 27 | 31 | 26 |
Feels °C | 23 | 22 | 25 | 24 | 24 | 22 | 28 | 26 | 26 | 29 | 28 | 27 | 30 | 31 | 29 | 29 | 30 | 28 | 29 | 30 | 28 |
Swell 1 Height (m) Direction Period (s) | — | — | S 9 | S 8 | S 8 | S 7 | SSE 8 | SSE 7 | S 6 | S 6 | SE 8 | SE 8 | SSW 6 | SE 8 | SSW 6 | S 6 | S 6 | SSW 6 | SSW 6 | SE 7 | SSW 6 |
— | — | 419 | 182 | 74 | 52 | 173 | 82 | 21 | 59 | 3 | 9 | 64 | 9 | 39 | 24 | 24 | 28 | 36 | 2 | 62 | |
Swell 2 Height (m) Direction Period (s) | — | — | — | SE 7 | SSE 7 | SSE 7 | — | SE 6 | SE 6 | E 10 | E 10 | E 11 | SE 7 | E 9 | SE 8 | SE 8 | SE 8 | SE 7 | SSE 7 | — | SE 10 |
— | — | — | 28 | 31 | 31 | — | 27 | 19 | 2 | 2 | 2 | 9 | 2 | 10 | 16 | 15 | 9 | 5 | — | 4 | |
Swell 3 Height (m) Direction Period (s) | — | — | — | — | — | E 12 | — | E 10 | E 10 | — | — | — | E 10 | — | — | E 9 | — | — | — | — | E 8 |
— | — | — | — | — | 3 | — | 2 | 2 | — | — | — | 2 | — | — | 1 | — | — | — | — | 1 | |
Wind waves Height (m) Direction Period (s) | S 8 | S 9 | NW 3 | — | — | — | N 3 | SW 3 | SSW 4 | — | S 6 | SSW 6 | — | SSW 6 | SSW 6 | — | — | — | — | SSW 6 | — |
724 | 835 | 1 | — | — | — | 1 | 5 | 6 | — | 89 | 139 | — | 68 | 58 | — | — | — | — | 48 | — | |
Nearest Offshore or Glassy | |||||||||||||||||||||
Distance (km) | 419 | 211 | 0 | 1 | 1 | 0 | 1 | 1 | 24 | 214 | 2607 | 211 | 214 | 211 | 3 | 26 | 1101 | 173 | 30 | 214 | 1499 |
Best forecast wave conditions in Rhode Island | |||||||||||||||||||||
Best forecast wave conditions in United States | |||||||||||||||||||||
Header Global | |||||||||||||||||||||
- Map Icons:
 Break
Break Live Wave Height (m)
 Live Wind Speed (km/h)
 Surf Rating (10 Max)
 Ocean Swells (m)
- Wind Speed (km/h)
Latest Updates


FREE! Surf-Forecast.com widget for your website
The surf report / weather widget below is available to embed on third party websites free of charge and provides a summary of our Fenway Beach surf forecast. Simply grab the html code snippet that we provide and paste it into your own site. You can choose your preferred language and metric/imperial units for the surf forecast feed to suit users of your site. Click here to get the code.
Information about the Fenway Beach Surf forecast
The above surf forecast table for Fenway Beach provides essential information for determining whether the surfing conditions will be good over the next 16 days. A general guide to surfing at Fenway Beach can be found by selecting the local surf guide option on the grey menu. Our Fenway Beach surf forecast is unique since it includes wave energy (power) that defines the real feel of the surf rather than just the height or the period. If you surf the same spot (Fenway Beach) regularly then make a mental note of the wave energy from the surf forecast table each time you go. Very soon you may start to choose your surf days based on the wave energy alone combined with our forecast of favourable offshore wind conditions. Our star ratings will help here and of course you will also find the usual wave height and period predictions on our surf forecasts as well as a full break down of the swell components under our advanced users option (to reveal that, click the little Einstein character under the tide times).
Further information to help with frequently asked questions about our surf forecast for Fenway Beach may be found under the help tab on the top menu and also by moving your mouse over the question marks on the surf forecast table itself. Please always bear in mind that the forecast is for near-shore open water and local factors at each surf break influence the actual breaking wave height, such as the beach / reef profile, water depths offshore and shelter.
 Nearest