
Surf Forecasts:

Gold Beach/South Park/Hunter Creek surf forecast from 2 Aug 2026:
- Best quality surf: Thursday 6 Aug, 5AM (local time) - 1.5ft (0.5m), 14s period, SW swell with cross-offshore winds.
- Most powerful swell: Sunday 2 Aug, 11PM (local time) - 7.5ft (2.3m), 8s period, NW swell with 706 kJ wave energy.
- Next surfable swell (1★+): Thursday 6 Aug, 5AM (local time) - 1.5ft (0.5m), 14s period with SW swell.
Best Forecast Surf Conditions for Gold Beach/South Park/Hunter Creek this week:
The surf forecast for Gold Beach/South Park/Hunter Creek over the next 16 days: The first swell (rated 1 star or higher) is forecast to arrive on Thursday (Aug 06) at 5AM. The primary swell is predicted to be 0.5m and 14s period with a secondary swell of 0.8m and 8s. Another secondary swell of 0.6m and 8s is also forecast. The wind is predicted to be cross-offshore as the swell arrives.
The most powerful waves expected at Gold Beach/South Park/Hunter Creek in the next 16 days are 2.3m 8s and forecast to arrive on Sunday (Aug 02) at 11PM. Winds are predicted to be cross-shore at the time the swell arrives. The largest open ocean swell (not directed at the beach) is 0.5m 3s period and expected on Monday (Aug 03) at 5AM.
| Wave Type | Time (PDT) & Date | Wave Height & Period |
|---|---|---|
| Next good surf (1 star+) | 5AM (Thu 6th Aug) | 1.5ft (0.5m) 14s |
| Best Surf | 5AM (Thu 6th Aug) | 1.5ft (0.5m) 14s |
| Most Powerful | 11PM (Sun 2nd Aug) | 7.5ft (2.3m) 8s |
Table - best surf conditions forecast for Gold Beach/South Park/Hunter Creek over the next 16 days.
The Lowdown
Let's get real about the next couple of weeks. I've been staring at this forecast for Gold Beach, and to be honest, it's a bit of a tough stretch for surfers. The conditions are going to be dominated by wind and messy, short-period swell for most of the period. Keep your expectations low for clean waves, but keep your eyes peeled for a couple of interesting windows that could offer something a bit different.
The two-week outlook starts off pretty grim. The swell's coming out of the NW with short 8-second periods, and the wind just won't let up. The wave energy is weak to moderate, mostly in the 300-600 range, and that's just not enough to sort out the surface chop. You'll see plenty of lumpy, cross-shore junk. With wind speeds hanging around 35-45 km/h from the NNW, it's just not worth paddling out.
That pattern holds for the first week. We'll see a small bump in size late Monday afternoon, August 3rd, with around 6 ft of 8-second windswell, but with a strong cross-shore wind, it will be a mess. Thursday, the 6th, is a dead loss, barely a ripple. The best you can say is the break is fairly consistent, but it's consistent at being poor.
Okay, let's look for a silver lining. There is a notable shift in the middle of the second week. Around Friday the 14th, we start seeing some longer-period energy sneaking in. It’s still small, but there's a pulse of 15-second swell showing up. Then, on Saturday the 15th, things might actually get a little interesting. The energy jumps up to the 1000s, and we’ve got a 17-second period swell in the mix. Sure, the wind is still cross-shore and the waves are small, but the quality potential is there. This is the most promising window of the whole forecast, but it's a long-range call, so stay flexible.
That longer period energy has the potential to hold some shape as it lines up for the west-facing sections of Gold Beach, especially through Sunday the 16th and into Monday the 17th. But it's small, and the wind will still be on it, so don't expect a classic day. It's a case of watching the potential, not planning on perfection.
Just as a heads-up, the water temperature is sitting right around average for this time of year, so it won't be a deciding factor in your wetsuit choice. This is all about finding a window where the wind eases off and that longer-period swell has a chance to show its face.
Rusty.
Short Range ForecastMostly dry. Warm (max 24°C on Mon afternoon, min 12°C on Sat night). Winds decreasing (strong winds from the NNW on Sun afternoon, light winds from the N by Tue morning). | Days 5-7 Weather SummaryMostly dry. Warm (max 23°C on Fri morning, min 17°C on Tue night). Winds increasing (light winds from the NNE on Wed night, fresh winds from the NNW by Fri afternoon). | ||||||||||||||||||
Sunday 2 | Monday 3 | Tuesday 4 | Wednesday 5 | Thursday 6 | Friday 7 | ||||||||||||||
Night | AM | PM | Night | AM | PM | Night | AM | PM | Night | AM | PM | Night | AM | PM | Night | AM | PM | Night | |
Swell Height Map | 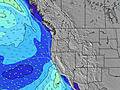 | 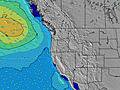 | 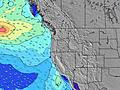 | 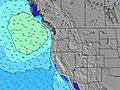 | 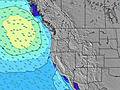 | 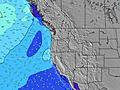 | 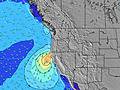 | ||||||||||||
Wave Height (m) Direction Period (s) | NW 7 | NW 8 | NW 9 | NW 8 | NW 8 | NW 8 | NW 8 | NW 8 | NW 8 | NW 9 | NW 8 | NW 8 | NW 8 | SW 13 | NW 8 | NW 8 | SW 18 | NW 7 | NW 7 |
Wave Graph | |||||||||||||||||||
269 | 414 | 505 | 619 | 260 | 434 | 260 | 264 | 264 | 300 | 216 | 289 | 88 | 113 | 164 | 94 | 102 | 131 | 102 | |
Wind (km/h) | |||||||||||||||||||
Wind State on-shore cross-onshore cross-shore cross-offshore off-shore glassy | cross-off | cross | cross | cross-off | cross | cross | cross-off | cross | cross-on | cross | cross-on | cross-on | cross | cross-on | cross-on | cross-off | cross | cross | cross |
High Tide | 2:16AM1.80m | 3:19PM1.85m | 3:04AM1.66m | 3:50PM1.92m | 4:01AM1.51m | 4:25PM1.97m | 5:11AM1.37m | 5:07PM2.02m | 6:38AM1.28m | 5:59PM2.05m | 8:16AM1.28m | 7:02PM2.09m | |||||||
Low Tide | 8:39PM0.60m | 8:53AM0.05m | 9:26PM0.52m | 9:24AM0.23m | 10:19PM0.42m | 9:58AM0.42m | 11:19PM0.33m | 10:38AM0.62m | 00:26AM0.23m | 11:28AM0.81m | 1:39AM0.10m | 12:35PM0.94m | 2:50AM-0.05m | ||||||
— | 6:09 | — | — | 6:11 | — | — | 6:11 | — | — | 6:13 | — | — | 6:13 | — | — | 6:15 | — | — | |
8:37 | — | 8:36 | — | — | 8:35 | — | — | 8:34 | — | — | 8:31 | — | — | 8:30 | — | — | 8:30 | — | |
mm | — | — | — | — | — | — | — | — | — | — | — | — | — | — | — | — | — | — | — |
Temp °C | 17 | 19 | 20 | 18 | 22 | 24 | 20 | 22 | 23 | 20 | 22 | 22 | 18 | 20 | 20 | 18 | 23 | 23 | 20 |
Feels °C | 11 | 12 | 12 | 11 | 15 | 16 | 14 | 18 | 20 | 17 | 20 | 21 | 17 | 19 | 19 | 16 | 18 | 18 | 15 |
Swell 1 Height (m) Direction Period (s) | WNW 7 | NW 8 | SW 13 | NW 8 | SW 13 | SW 13 | NW 8 | NW 8 | SW 15 | NW 9 | NW 8 | NW 7 | NW 8 | NW 8 | NW 7 | NW 8 | SW 13 | SW 13 | NW 7 |
164 | 274 | 63 | 367 | 44 | 27 | 260 | 264 | 58 | 300 | 216 | 137 | 88 | 71 | 77 | 94 | 79 | 79 | 102 | |
Swell 2 Height (m) Direction Period (s) | SW 14 | SW 14 | WSW 18 | SW 13 | WSW 17 | SW 16 | SW 16 | SW 16 | SSW 12 | SW 15 | SW 14 | WNW 8 | WNW 8 | W 8 | SW 13 | SW 13 | SW 18 | SW 18 | SW 12 |
95 | 91 | 31 | 44 | 30 | 41 | 66 | 64 | 14 | 55 | 73 | 41 | 70 | 33 | 85 | 61 | 81 | 82 | 53 | |
Swell 3 Height (m) Direction Period (s) | WSW 19 | SW 19 | S 12 | SW 18 | S 12 | — | SW 12 | SSW 12 | S 15 | SSW 12 | — | SW 14 | SW 14 | SW 13 | WNW 8 | SSW 19 | WNW 8 | S 12 | SW 18 |
37 | 14 | 12 | 49 | 3 | — | 24 | 14 | 4 | 14 | — | 70 | 67 | 113 | 24 | 36 | 7 | 3 | 49 | |
Wind waves Height (m) Direction Period (s) | NW 7 | NW 8 | NW 9 | NW 8 | NW 8 | NW 8 | — | — | NW 8 | — | — | NW 8 | — | — | NW 8 | — | NW 7 | NW 7 | — |
269 | 414 | 505 | 619 | 260 | 434 | — | — | 264 | — | — | 289 | — | — | 164 | — | 102 | 131 | — | |
Nearest Offshore or Glassy | |||||||||||||||||||
Distance (km) | 58 | 503 | 975 | 58 | 430 | 266 | 10 | 72 | 72 | 10 | 10 | 10 | 10 | 10 | 72 | 10 | 72 | 267 | 10 |
Best forecast wave conditions in South Oregon | |||||||||||||||||||
Best forecast wave conditions in United States | |||||||||||||||||||
Header Global | |||||||||||||||||||
- Map Icons:
 Break
Break Live Wave Height (m)
 Live Wind Speed (km/h)
 Surf Rating (10 Max)
 Ocean Swells (m)
- Wind Speed (km/h)
Latest Updates


FREE! Surf-Forecast.com widget for your website
The surf report / weather widget below is available to embed on third party websites free of charge and provides a summary of our Gold Beach/South Park/Hunter Creek surf forecast. Simply grab the html code snippet that we provide and paste it into your own site. You can choose your preferred language and metric/imperial units for the surf forecast feed to suit users of your site. Click here to get the code.
Information about the Gold Beach/South Park/Hunter Creek Surf forecast
The above surf forecast table for Gold Beach/South Park/Hunter Creek provides essential information for determining whether the surfing conditions will be good over the next 16 days. A general guide to surfing at Gold Beach/South Park/Hunter Creek can be found by selecting the local surf guide option on the grey menu. Our Gold Beach/South Park/Hunter Creek surf forecast is unique since it includes wave energy (power) that defines the real feel of the surf rather than just the height or the period. If you surf the same spot (Gold Beach/South Park/Hunter Creek) regularly then make a mental note of the wave energy from the surf forecast table each time you go. Very soon you may start to choose your surf days based on the wave energy alone combined with our forecast of favourable offshore wind conditions. Our star ratings will help here and of course you will also find the usual wave height and period predictions on our surf forecasts as well as a full break down of the swell components under our advanced users option (to reveal that, click the little Einstein character under the tide times).
Further information to help with frequently asked questions about our surf forecast for Gold Beach/South Park/Hunter Creek may be found under the help tab on the top menu and also by moving your mouse over the question marks on the surf forecast table itself. Please always bear in mind that the forecast is for near-shore open water and local factors at each surf break influence the actual breaking wave height, such as the beach / reef profile, water depths offshore and shelter.
Gold Beach/South Park/Hunter Creek is 91 km (57 miles) from Grants Pass. If you plan a vacation in South Oregon, look for hotels and other accommodation in Grants Pass. Grants Pass has rooms for a wide range of budgets as well as car hire and transport links.
 Nearest