

Surf Forecasts:

How big are the waves at Gold Beach/South Park/Hunter Creek today (03 Aug):
- Morning surf: Morning surf (03 Aug, local time) - 4.5ft (1.3m), 8s period with NW swell.
- Afternoon surf: Afternoon surf (03 Aug, local time) - 5.5ft (1.7m), 8s period with NW swell.
- Evening surf: Evening surf (03 Aug, local time) - 5ft (1.6m), 8s period with NW swell.
The current surf forecast for Gold Beach/South Park/Hunter Creek at 4AM is: 1.5m 8s primary swell from a Northwest direction and 0.4m 13s secondary swell from a Southwest direction (forecast issued at 10:00pm August 02). An open ocean swell of 0.4m 3s is not directed at the surf break. The wind direction is predicted to be cross-offshore.
| Time (PDT) & Date | Wave Height | Wave Period |
|---|---|---|
| Morning (03 Aug) | 4.5ft (1.3m) | 8s |
| Afternoon (03 Aug) | 5.5ft (1.7m) | 8s |
| Evening (03 Aug) | 5ft (1.6m) | 8s |
Table - waves today at Gold Beach/South Park/Hunter Creek. (Swell directed towards the surf break)
Short Range ForecastMostly dry. Warm (max 24°C on Mon afternoon, min 13°C on Sun night). Winds decreasing (strong winds from the NNW on Mon afternoon, light winds from the NW by Wed afternoon). | ||||||||||||||||||
Sun 2 | Monday 3 | Tuesday 4 | ||||||||||||||||
8 PM | 11 PM | 2 AM | 5 AM | 8 AM | 11 AM | 2 PM | 5 PM | 8 PM | 11 PM | 2 AM | 5 AM | 8 AM | 11 AM | 2 PM | 5 PM | 8 PM | 11 PM | |
Swell Height Map | 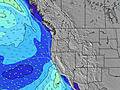 | 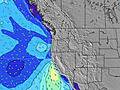 | 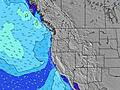 | 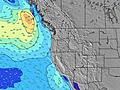 | 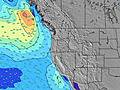 | 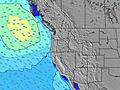 | 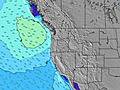 | |||||||||||
Wave Height (m) Direction Period (s) | NW 8 | NW 8 | NW 8 | NW 8 | NW 8 | NW 8 | NNW 8 | NW 8 | NW 8 | NNW 8 | NW 8 | NW 8 | NW 8 | NW 8 | NW 8 | NW 8 | NW 8 | NW 8 |
Wave Graph | ||||||||||||||||||
459 | 401 | 346 | 299 | 239 | 233 | 348 | 371 | 338 | 572 | 227 | 233 | 233 | 203 | 221 | 270 | 277 | 299 | |
Wind (km/h) | ||||||||||||||||||
Wind State on-shore cross-onshore cross-shore cross-offshore off-shore glassy | cross | cross | cross-off | cross-off | cross-off | cross | cross | cross | cross | cross | cross-off | cross-off | cross-off | cross | cross-on | cross-on | cross | cross |
High Tide | 3:04AM1.66m | 3:50PM1.92m | 4:01AM1.51m | 4:25PM1.97m | ||||||||||||||
Low Tide | 9:26PM0.52m | 9:24AM0.23m | 10:19PM0.42m | 9:58AM0.42m | ||||||||||||||
— | — | — | 6:11 | — | — | — | — | — | — | — | 6:11 | — | — | — | — | — | — | |
8:36 | — | — | — | — | — | — | — | 8:35 | — | — | — | — | — | — | — | 8:34 | — | |
mm | — | — | — | — | — | — | — | — | — | — | — | — | — | — | — | — | — | — |
Temp °C | 18 | 14 | 14 | 13 | 15 | 22 | 24 | 24 | 20 | 17 | 17 | 16 | 18 | 23 | 23 | 23 | 20 | 18 |
Feels °C | 11 | 9 | 9 | 8 | 10 | 15 | 16 | 17 | 14 | 12 | 13 | 12 | 15 | 20 | 19 | 19 | 17 | 17 |
Swell 1 Height (m) Direction Period (s) | SW 13 | NW 8 | NW 8 | NW 8 | NW 8 | NW 8 | SW 13 | SW 13 | SW 16 | NW 8 | NW 8 | NW 8 | NW 8 | NW 8 | SW 16 | SW 15 | NW 8 | NW 8 |
63 | 401 | 346 | 299 | 239 | 233 | 27 | 27 | 41 | 289 | 227 | 233 | 233 | 203 | 62 | 58 | 277 | 299 | |
Swell 2 Height (m) Direction Period (s) | WSW 18 | SW 13 | SW 13 | SW 13 | SW 13 | SW 13 | WSW 17 | SW 16 | SW 13 | SW 16 | SW 16 | SW 16 | SW 16 | SW 16 | SSW 12 | SSW 12 | SW 15 | SW 15 |
31 | 62 | 44 | 44 | 44 | 44 | 28 | 41 | 26 | 66 | 66 | 41 | 65 | 64 | 14 | 14 | 57 | 56 | |
Swell 3 Height (m) Direction Period (s) | S 13 | SW 18 | SW 18 | WSW 18 | WSW 18 | WSW 17 | S 12 | S 13 | S 12 | SW 13 | SW 12 | SW 12 | SSW 12 | SSW 12 | S 15 | S 15 | SSW 12 | SSW 12 |
12 | 80 | 49 | 30 | 30 | 30 | 3 | 3 | 3 | 25 | 24 | 24 | 15 | 14 | 17 | 4 | 14 | 14 | |
Wind waves Height (m) Direction Period (s) | NW 8 | NE 3 | NNE 3 | NNE 3 | NNE 3 | N 3 | NNW 8 | NW 8 | NW 8 | NNW 8 | — | NNE 2 | — | — | NW 8 | NW 8 | — | — |
459 | 2 | 5 | 4 | 4 | 6 | 348 | 371 | 338 | 572 | — | 1 | — | — | 221 | 270 | — | — | |
Nearest Offshore or Glassy | ||||||||||||||||||
Distance (km) | 349 | 72 | 58 | 10 | 10 | 432 | 268 | 266 | 72 | 58 | 10 | 10 | 10 | 72 | 72 | 58 | 58 | 10 |
Best forecast wave conditions in South Oregon | ||||||||||||||||||
Best forecast wave conditions in United States | ||||||||||||||||||
Header Global | ||||||||||||||||||
- Map Icons:
 Break
Break Live Wave Height (m)
 Live Wind Speed (km/h)
 Surf Rating (10 Max)
 Ocean Swells (m)
- Wind Speed (km/h)
Latest Updates


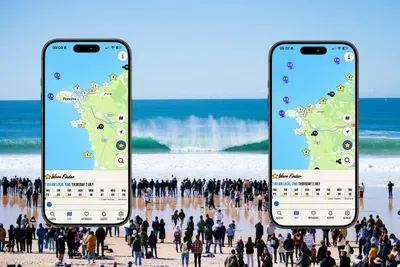

FREE! Surf-Forecast.com widget for your website
The surf report / weather widget below is available to embed on third party websites free of charge and provides a summary of our Gold Beach/South Park/Hunter Creek surf forecast. Simply grab the html code snippet that we provide and paste it into your own site. You can choose your preferred language and metric/imperial units for the surf forecast feed to suit users of your site. Click here to get the code.
 Nearest