

Surf Forecasts:

South Padre Island surf forecast from 3 Aug 2026:
- Most powerful swell: Friday 7 Aug, 1PM (local time) - 3ft (0.9m), 6s period, SE swell with 56 kJ wave energy.
Best Forecast Surf Conditions for South Padre Island this week:
The most powerful waves expected at South Padre Island in the next 16 days are 0.9m 6s and forecast to arrive on Friday (Aug 07) at 1PM. Winds are predicted to be cross-onshore at the time the swell arrives.
| Wave Type | Time (CDT) & Date | Wave Height & Period |
|---|---|---|
| Next good surf (1 star+) | - | - |
| Best Surf | - | - |
| Most Powerful | 1PM (Fri 7th Aug) | 3ft (0.9m) 6s |
Table - best surf conditions forecast for South Padre Island over the next 16 days.
The Lowdown
Alright folks, Rusty here. Let's be straight with you. Looking at the next couple of weeks, we've got a whole lot of "meh" on the menu for South Padre. The surf is going to be small and the wind is going to be your main enemy for most of the run. It's not a total write-off, but you're gonna have to pick your moments and lower your expectations.
We start off with a pretty flat, choppy mess from Monday, August 3rd. There’s just no energy in the water, with combined energy readings barely registering (18-39). The swell is tiny, with onshore winds making it lumpy and mostly unrideable. This pattern of small, cross-onshore surf is going to stick with us for the better part of the first week. A bit of a bump shows late Thursday afternoon, August 6th, but it's still a junky 4ft with a short period and a fresh cross-onshore breeze, so it’ll be messy.
The standout of the whole stretch—and honestly, the only real surf window—looks to be around South Padre Island on Thursday, August 13th. We finally see some energy kick in, with the swell building to 4ft out of the ESE. The combined energy jumps up to a moderate 224, which is the strongest reading we get all run. The period stretches out to 7 seconds, which isn't long period, but it's a step up. The morning starts a bit more manageable, with a cross-shore wind and the swell at 3ft. This is your best bet for a few clean-ish, punchy waves. It's not a classic, but it's the best on offer. The water temp is about average for this time of year, so it'll be warm.
After that little pulse, the energy fades away again. The following week drops right back into that poor surf pattern, with small, weak swells and the constant cross-onshore wind messing everything up. The weekend of the 15th-16th is looking particularly weak. A couple of afternoons later in the run on August 18th see a bit of size return to 3ft, but with weak energy (53) and a short period, it’s not going to be anything to get excited about.
All in all, we've got one window of "maybe" on the 13th, and a whole lotta flat, blown-out days surrounding it. If you can, save your energy for that Thursday.
Rusty.
Short Range ForecastMostly dry. Warm (max 29°C on Mon afternoon, min 27°C on Sun night). Mainly fresh winds. | Days 4-6 Weather SummaryLight rain (total 2mm), mostly falling on Fri night. Warm (max 29°C on Thu morning, min 27°C on Thu night). Winds decreasing (fresh winds from the SE on Thu morning, light winds from the SE by Fri night). | ||||||||||||||||||||
Monday 3 | Tuesday 4 | Wednesday 5 | Thursday 6 | Friday 7 | Saturday 8 | Sunday 9 | |||||||||||||||
AM | PM | Night | AM | PM | Night | AM | PM | Night | AM | PM | Night | AM | PM | Night | AM | PM | Night | AM | PM | Night | |
Swell Height Map | 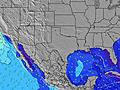 | 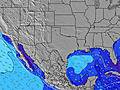 | 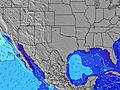 | 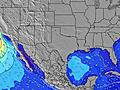 | 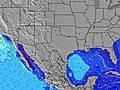 | 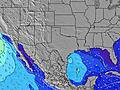 | 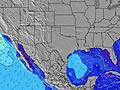 | ||||||||||||||
Wave Height (m) Direction Period (s) | SE 6 | SE 4 | SE 4 | SE 5 | SE 4 | SE 5 | SE 5 | SE 4 | ESE 6 | SE 6 | SE 5 | ESE 6 | ESE 6 | ESE 6 | ESE 6 | ESE 5 | ESE 6 | ESE 6 | E 5 | ESE 6 | ESE 5 |
Wave Graph | |||||||||||||||||||||
11 | 15 | 21 | 21 | 31 | 25 | 29 | 26 | 44 | 32 | 51 | 46 | 47 | 51 | 40 | 23 | 40 | 33 | 21 | 31 | 35 | |
Wind (km/h) | |||||||||||||||||||||
Wind State on-shore cross-onshore cross-shore cross-offshore off-shore glassy | cross-on | cross-on | cross | cross-on | cross-on | cross-on | cross-on | cross-on | cross-on | cross-on | cross-on | cross-on | cross-on | cross-on | cross-on | cross-on | on | cross-on | cross-on | cross-on | cross-on |
High Tide | 6:50AM0.50m | 7:43PM0.44m | 6:45AM0.50m | 10:23PM0.46m | 6:30AM0.51m | 5:46AM0.54m | 3:30AM0.59m | 3:49AM0.65m | 4:26AM0.68m | ||||||||||||
Low Tide | 1:33PM0.31m | 00:36AM0.38m | 2:17PM0.26m | 00:51AM0.45m | 3:09PM0.20m | 4:09PM0.14m | 5:14PM0.08m | 6:20PM0.03m | 7:23PM-0.01m | ||||||||||||
6:54 | — | — | 6:54 | — | — | 6:54 | — | — | 6:56 | — | — | 6:56 | — | — | 6:56 | — | — | 6:56 | — | — | |
— | 8:15 | — | — | 8:14 | — | — | 8:14 | — | — | 8:13 | — | — | 8:12 | — | — | 8:10 | — | — | 8:10 | — | |
mm | — | — | — | — | — | — | — | — | — | — | — | — | — | — | 1 | 1 | — | — | — | — | — |
Temp °C | 28 | 29 | 28 | 28 | 29 | 28 | 29 | 29 | 28 | 29 | 28 | 28 | 28 | 29 | 28 | 28 | 28 | 28 | 28 | 28 | 28 |
Feels °C | 32 | 29 | 29 | 30 | 29 | 30 | 30 | 29 | 29 | 28 | 27 | 29 | 31 | 30 | 30 | 31 | 30 | 30 | 30 | 27 | 29 |
Swell 1 Height (m) Direction Period (s) | E 10 | ESE 9 | ESE 9 | E 9 | ESE 9 | E 8 | E 8 | — | — | — | — | — | — | — | E 8 | ESE 5 | ESE 6 | E 9 | E 5 | — | — |
7 | 8 | 8 | 6 | 8 | 1 | 1 | — | — | — | — | — | — | — | 1 | 23 | 40 | 2 | 21 | — | — | |
Swell 2 Height (m) Direction Period (s) | — | — | — | — | — | — | — | — | — | — | — | — | — | — | — | E 9 | SE 9 | — | E 9 | — | — |
— | — | — | — | — | — | — | — | — | — | — | — | — | — | — | 2 | 3 | — | 2 | — | — | |
Swell 3 Height (m) Direction Period (s) | — | — | — | — | — | — | — | — | — | — | — | — | — | — | — | — | — | — | — | — | — |
— | — | — | — | — | — | — | — | — | — | — | — | — | — | — | — | — | — | — | — | — | |
Wind waves Height (m) Direction Period (s) | SE 6 | SE 4 | SE 4 | SE 5 | SE 4 | SE 5 | SE 5 | SE 4 | ESE 6 | SE 6 | SE 5 | ESE 6 | ESE 6 | ESE 6 | ESE 6 | — | ESE 6 | ESE 6 | — | ESE 6 | ESE 5 |
11 | 15 | 21 | 21 | 31 | 25 | 29 | 26 | 44 | 32 | 51 | 46 | 47 | 51 | 40 | — | 33 | 33 | — | 31 | 35 | |
Nearest Offshore or Glassy | |||||||||||||||||||||
Distance (km) | 974 | 1187 | 971 | 974 | 1109 | 971 | 974 | 1059 | 971 | 974 | 1201 | 971 | 974 | 1062 | 971 | 974 | 999 | 974 | 974 | 1003 | 971 |
Best forecast wave conditions in Texas | |||||||||||||||||||||
Best forecast wave conditions in United States | |||||||||||||||||||||
Header Global | |||||||||||||||||||||
- Map Icons:
 Break
Break Live Wave Height (m)
 Live Wind Speed (km/h)
 Surf Rating (10 Max)
 Ocean Swells (m)
- Wind Speed (km/h)
Latest Updates


FREE! Surf-Forecast.com widget for your website
The surf report / weather widget below is available to embed on third party websites free of charge and provides a summary of our South Padre Island surf forecast. Simply grab the html code snippet that we provide and paste it into your own site. You can choose your preferred language and metric/imperial units for the surf forecast feed to suit users of your site. Click here to get the code.
Information about the South Padre Island Surf forecast
The above surf forecast table for South Padre Island provides essential information for determining whether the surfing conditions will be good over the next 16 days. A general guide to surfing at South Padre Island can be found by selecting the local surf guide option on the grey menu. Our South Padre Island surf forecast is unique since it includes wave energy (power) that defines the real feel of the surf rather than just the height or the period. If you surf the same spot (South Padre Island) regularly then make a mental note of the wave energy from the surf forecast table each time you go. Very soon you may start to choose your surf days based on the wave energy alone combined with our forecast of favourable offshore wind conditions. Our star ratings will help here and of course you will also find the usual wave height and period predictions on our surf forecasts as well as a full break down of the swell components under our advanced users option (to reveal that, click the little Einstein character under the tide times).
Further information to help with frequently asked questions about our surf forecast for South Padre Island may be found under the help tab on the top menu and also by moving your mouse over the question marks on the surf forecast table itself. Please always bear in mind that the forecast is for near-shore open water and local factors at each surf break influence the actual breaking wave height, such as the beach / reef profile, water depths offshore and shelter.
South Padre Island is 66 km (41 miles) from Harlingen. If you plan a vacation in Texas, look for hotels and other accommodation in Harlingen. Harlingen has rooms for a wide range of budgets as well as car hire and transport links.
 Nearest