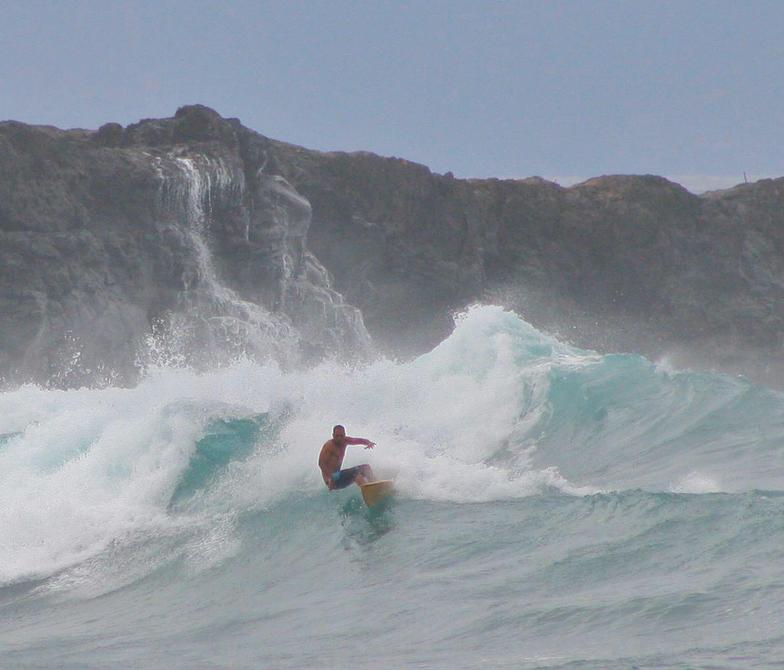


Surf Forecasts:
JT Flemming surf forecast from 26 Oct 2026:
- Best quality surf: Tuesday 27 Oct, 5AM (local time) - 4ft (1.2m), 15s period, NW swell with cross-offshore winds.
- Most powerful swell: Sunday 1 Nov, 5AM (local time) - 5ft (1.6m), 18s period, NNW swell with 1,539 kJ wave energy.
- Next surfable swell (1★+): Tuesday 27 Oct, 5AM (local time) - 4ft (1.2m), 15s period with NW swell.
Best Forecast Surf Conditions for JT Flemming this week:
The surf forecast for JT Flemming over the next 16 days: The first swell (rated 1 star or higher) is forecast to arrive on Tuesday (Oct 27) at 5AM. The primary swell is predicted to be 1.2m and 15s period with a secondary swell of 1.1m and 9s. The wind is predicted to be cross-offshore as the swell arrives.
The most powerful waves expected at JT Flemming in the next 16 days are 1.6m 18s and forecast to arrive on Sunday (Nov 01) at 5AM. Winds are predicted to be cross-shore at the time the swell arrives. The largest open ocean swell (not directed at the beach) is 0.7m 15s period and expected on Friday (Oct 30) at 5AM.
| Wave Type | Time (HST) & Date | Wave Height & Period |
|---|---|---|
| Next good surf (1 star+) | 5AM (Tue 27th Oct) | 4ft (1.2m) 15s |
| Best Surf | 5AM (Tue 27th Oct) | 4ft (1.2m) 15s |
| Most Powerful | 5AM (Sun 1st Nov) | 5ft (1.6m) 18s |
Table - best surf conditions forecast for JT Flemming over the next 16 days.
Short Range ForecastHeavy rain (total 28mm), heaviest during Tue night. Warm (max 24°C on Mon morning, min 20°C on Tue night). Wind will be generally light. | Days 4-6 Weather SummaryHeavy rain (total 24mm), heaviest during Thu morning. Warm (max 25°C on Thu night, min 24°C on Thu morning). Wind will be generally light. | ||||||||||||||||||||
Monday 26 | Tuesday 27 | Wednesday 28 | Thursday 29 | Friday 30 | Saturday 31 | Sunday 1 | |||||||||||||||
AM | PM | Night | AM | PM | Night | AM | PM | Night | AM | PM | Night | AM | PM | Night | AM | PM | Night | AM | PM | Night | |
Swell Height Map | 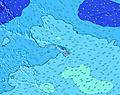 | 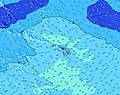 |  |  |  |  |  | ||||||||||||||
Wave Height (m) Direction Period (s) | NNW 18 | NNW 16 | NW 15 | NW 14 | NW 14 | NW 13 | NW 13 | NW 12 | NW 12 | NNE 11 | NNE 11 | NNE 10 | NNE 10 | NNE 9 | NNE 9 | NNE 9 | NNW 22 | NNW 20 | NNW 17 | NNW 16 | NNW 15 |
Wave Graph  | |||||||||||||||||||||
 kJ kJ | 270 | 464 | 657 | 658 | 630 | 437 | 277 | 172 | 169 | 173 | 164 | 154 | 135 | 100 | 70 | 58 | 408 | 1195 | 1498 | 1469 | 1162 |
Wind (km/h) | |||||||||||||||||||||
Wind State on-shore cross-onshore cross-shore cross-offshore off-shore glassy | cross-on | cross-on | cross | cross | cross-on | cross-on | cross | cross | cross-off | cross | cross | cross-off | cross | cross | cross | cross | cross-off | cross | cross | cross | cross |
High Tide | 2:07PM0.52m | 3:47AM0.90m | 2:34PM0.48m | 4:34AM0.90m | 2:58PM0.43m | 5:27AM0.87m | 3:14PM0.40m | 6:28AM0.83m | 7:39AM0.79m | 8:53AM0.75m | 9:48PM0.33m | ||||||||||
Low Tide | 9:31AM0.31m | 8:25PM-0.00m | 10:26AM0.33m | 8:57PM-0.01m | 11:30AM0.36m | 9:32PM0.01m | 12:59PM0.38m | 10:10PM0.06m | 10:55PM0.12m | 11:56PM0.20m | 5:25PM0.28m | 1:50AM0.29m | |||||||||
 |  |  | |  |  |  | |  | |  |  |  | |  | | | | | | | |
 | 6:26 | — | — | 6:26 | — | — | 6:26 | — | — | 6:26 | — | — | 6:28 | — | — | 6:28 | — | — | 6:28 | — | — |
 | — | 5:53 | — | — | 5:52 | — | — | 5:52 | — | — | 5:52 | — | — | 5:52 | — | — | 5:51 | — | — | 5:51 | — |
mm | — | — | — | — | 1 | 15 | 9 | 3 | — | 6 | 4 | 6 | 1 | 2 | 4 | 1 | — | — | — | — | 2 |
Temp °C | 24 | 24 | 24 | 24 | 24 | 23 | 21 | 23 | 24 | 24 | 24 | 25 | 25 | 25 | 24 | 24 | 24 | 24 | 25 | 25 | 25 |
Feels °C | 25 | 24 | 25 | 26 | 25 | 25 | 21 | 23 | 26 | 26 | 26 | 29 | 29 | 27 | 25 | 25 | 25 | 24 | 24 | 24 | 24 |
Swell 1 Height (m) Direction Period (s) | NNW 10 | NNW 9 | NW 15 | NW 14 | NW 14 | NW 13 | NNE 10 | NW 12 | NW 12 | NNE 11 | NNE 11 | NNE 10 | NNE 10 | NNE 9 | NNE 9 | NNE 9 | NNE 8 | NNW 20 | NNW 17 | NNW 16 | NNW 15 |
| kJ | 245 | 225 | 657 | 658 | 630 | 437 | 245 | 172 | 169 | 173 | 164 | 154 | 135 | 100 | 70 | 58 | 53 | 1195 | 1498 | 1469 | 1162 |
Swell 2 Height (m) Direction Period (s) | NNW 18 | NNW 16 | N 9 | N 9 | N 9 | SSW 15 | NW 13 | N 9 | N 9 | SSW 16 | SSW 16 | SSW 15 | S 14 | S 14 | S 13 | S 13 | NNW 22 | NNE 8 | SSW 13 | SSW 13 | SSW 14 |
| kJ | 270 | 464 | 246 | 166 | 164 | 128 | 277 | 106 | 56 | 203 | 198 | 174 | 153 | 148 | 130 | 89 | 408 | 120 | 53 | 55 | 68 |
Swell 3 Height (m) Direction Period (s) | SSW 15 | SSW 15 | SSW 14 | SSW 13 | SSW 13 | E 6 | S 15 | S 14 | NNE 11 | NW 11 | NW 11 | NW 11 | NW 10 | E 13 | NW 12 | E 12 | S 13 | S 15 | E 12 | E 11 | E 11 |
| kJ | 123 | 169 | 110 | 58 | 57 | 3 | 109 | 104 | 73 | 99 | 75 | 57 | 26 | 29 | 39 | 46 | 92 | 121 | 24 | 22 | 21 |
Wind waves Height (m) Direction Period (s) | — | — | — | — | NNE 3 | N 9 | E 7 | NE 4 | ENE 4 | ENE 4 | — | — | — | NE 4 | ENE 4 | ENE 4 | NE 4 | — | NE 8 | NE 8 | NE 5 |
| kJ | — | — | — | — | 1 | 162 | 4 | 23 | 20 | 23 | — | — | — | 6 | 11 | 20 | 27 | — | 187 | 138 | 65 |
Nearest Offshore or Glassy | |||||||||||||||||||||
Distance (km) | 12 | 2 | 1 | 2 | 2 | 2 | 12 | 7 | 5 | 1 | 1 | 0 | 1 | 5 | 1 | 12 | 0 | 1 | 12 | 12 | 12 |
Best forecast wave conditions in Maui | |||||||||||||||||||||
Best forecast wave conditions in United States | |||||||||||||||||||||
Header Global | |||||||||||||||||||||
- Map Icons:
 Break
Break Live Wave Height (m)
 Live Wind Speed (km/h)
 Surf Rating (10 Max)
 Ocean Swells (m)
- Wind Speed (km/h)


FREE! Surf-Forecast.com widget for your website
The surf report / weather widget below is available to embed on third party websites free of charge and provides a summary of our JT Flemming surf forecast. Simply grab the html code snippet that we provide and paste it into your own site. You can choose your preferred language and metric/imperial units for the surf forecast feed to suit users of your site. Click here to get the code.

Information about the JT Flemming Surf forecast
The above surf forecast table for JT Flemming provides essential information for determining whether the surfing conditions will be good over the next 16 days. A general guide to surfing at JT Flemming can be found by selecting the local surf guide option on the grey menu. Our JT Flemming surf forecast is unique since it includes wave energy (power) that defines the real feel of the surf rather than just the height or the period. If you surf the same spot (JT Flemming) regularly then make a mental note of the wave energy from the surf forecast table each time you go. Very soon you may start to choose your surf days based on the wave energy alone combined with our forecast of favourable offshore wind conditions. Our star ratings will help here and of course you will also find the usual wave height and period predictions on our surf forecasts as well as a full break down of the swell components under our advanced users option (to reveal that, click the little Einstein character under the tide times).
Further information to help with frequently asked questions about our surf forecast for JT Flemming may be found under the help tab on the top menu and also by moving your mouse over the question marks on the surf forecast table itself. Please always bear in mind that the forecast is for near-shore open water and local factors at each surf break influence the actual breaking wave height, such as the beach / reef profile, water depths offshore and shelter.
JT Flemming is 21 km (13 miles) from Wailuku. If you plan a vacation in Maui, look for hotels and other accommodation in Wailuku. Wailuku has rooms for a wide range of budgets as well as car hire and transport links.
 Nearest