

Surf Forecasts:

Freshwater and Harbord surf forecast from 3 Aug 2026:
- Best quality surf: Sunday 9 Aug, 4AM (local time) - 5ft (1.6m), 7s period, NE swell with cross-offshore winds.
- Most powerful swell: Saturday 8 Aug, 10PM (local time) - 6ft (1.9m), 6s period, NE swell with 284 kJ wave energy.
- Next surfable swell (1★+): Monday 3 Aug, 4PM (local time) - 3ft (0.9m), 11s period with SE swell.
Best Forecast Surf Conditions for Freshwater and Harbord this week:
The surf forecast for Freshwater and Harbord over the next 16 days: The first swell (rated 1 star or higher) is forecast to arrive on Monday (Aug 03) at 4PM. The primary swell is predicted to be 0.9m and 11s period with a secondary swell of 0.2m and 15s. Another secondary swell of 0.6m and 4s is also forecast. The wind is predicted to be cross-offshore as the swell arrives.
The most powerful waves expected at Freshwater and Harbord in the next 16 days are 1.9m 6s and forecast to arrive on Saturday (Aug 08) at 10PM. Winds are predicted to be cross-offshore at the time the swell arrives. The largest open ocean swell (not directed at the beach) is 1.0m 9s period and expected on Thursday (Aug 06) at 10PM.
| Wave Type | Time (AEST) & Date | Wave Height & Period |
|---|---|---|
| Next good surf (1 star+) | 4PM (Mon 3rd Aug) | 3ft (0.9m) 11s |
| Best Surf | 4AM (Sun 9th Aug) | 5ft (1.6m) 7s |
| Most Powerful | 10PM (Sat 8th Aug) | 6ft (1.9m) 6s |
Table - best surf conditions forecast for Freshwater and Harbord over the next 16 days.
The Lowdown
Alright, let me break it down for ya. Rusty here, and I gotta be straight with you – it's a quiet stretch ahead for Freshwater and Harbord. The next couple of weeks are looking pretty average, so don't get your hopes up for anything epic.
The pattern is a long, drawn-out lull. We've got a few days of tiny, weak surf to kick things off, then a decent little spike in size around the 9th, but it's messy. After that, it's back to small, unremarkable conditions. The water's sitting at 63°F which is a bit cooler than usual for this time of year, but nothing too crazy.
Let's run through it. The best bet on offer is actually Monday morning, August 3rd. It's not a classic, but it's the pick of a pretty average bunch. We're looking at a 3ft swell from the SE with a period of 11 seconds, giving us a moderate combined energy of 236. The wind is a light cross-off from the NNW at 9 mph, which will keep the surface clean. It's surfable, but it's ordinary. Expect some crowds at this spot, especially since it's a consistent beginner-friendly wave.
Tuesday morning, the 4th, drops right off. We're talking 1ft and then 0.7ft in the afternoon with glassy conditions, but it's just too small to bother with. The rest of the first week is a write-off – tiny swell, and the wind is all over the place from cross-off to cross-on. The combined energy values are mostly two-digit, weak numbers.
Now, Sunday, August 9th, brings a bit more size. We're seeing 4ft from the NE in the morning, with a short period of 6 seconds. The combined energy jumps to 152 (moderate), and the wind is offshore from the NNW at 16 mph. It'll be clean, but that short period means the waves will be soft and crumbly. It's a far cry from good, and the score is still a zero. The afternoon is similar, with 4ft and a good offshore wind, but the swell is still junky.
After that, it's back to the doldrums. From the 10th through the 18th, we're looking at swell heights mostly under 3ft, weak energy, and winds that are either cross or cross-on. There's a tiny mention of 2ft on the morning of the 18th with glassy conditions, but it's just not enough.
Honestly, if you're really keen, Monday morning the 3rd is your only window for something half-decent. For the rest of the run, you're better off checking the forecast again in a few days. Conditions can change, but right now, it's a snooze fest.
Rusty.
Short Range ForecastMostly dry. Warm (max 22°C on Mon afternoon, min 9°C on Tue night). Wind will be generally light. | Days 4-6 Weather SummaryMostly dry. Very mild (max 16°C on Sat afternoon, min 9°C on Thu night). Wind will be generally light. | ||||||||||||||||||||
Monday 3 | Tuesday 4 | Wednesday 5 | Thursday 6 | Friday 7 | Saturday 8 | Sunday 9 | |||||||||||||||
AM | PM | Night | AM | PM | Night | AM | PM | Night | AM | PM | Night | AM | PM | Night | AM | PM | Night | AM | PM | Night | |
Swell Height Map | 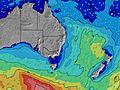 | 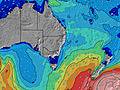 | 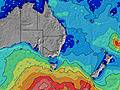 | 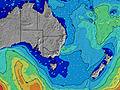 | 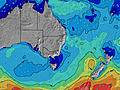 | 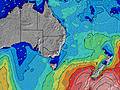 | 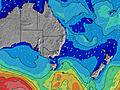 | ||||||||||||||
Wave Height (m) Direction Period (s) | SE 11 | SE 11 | SE 10 | SE 10 | SSE 10 | SW 5 | SW 5 | E 9 | E 12 | E 10 | E 12 | ENE 9 | NE 7 | SSE 10 | E 10 | E 8 | E 8 | NE 7 | NE 6 | NE 7 | ENE 8 |
Wave Graph | |||||||||||||||||||||
229 | 163 | 68 | 25 | 9 | 31 | 23 | 15 | 11 | 16 | 25 | 16 | 12 | 35 | 29 | 19 | 19 | 267 | 91 | 116 | 100 | |
Wind (km/h) | |||||||||||||||||||||
Wind State on-shore cross-onshore cross-shore cross-offshore off-shore glassy | cross-off | cross-off | cross-off | cross-off | glassy | cross-off | cross-off | cross | cross-off | cross-off | cross | cross-off | cross-off | cross-on | glassy | glassy | cross | cross-off | cross-off | off | cross-off |
High Tide | 11:18AM1.26m | 11:12PM1.31m | 12:03PM1.29m | 00:01AM1.20m | 12:53PM1.33m | 1:00AM1.09m | 1:52PM1.36m | 2:14AM1.00m | 2:58PM1.42m | 3:39AM0.96m | 4:06PM1.49m | 4:58AM0.98m | 5:10PM1.58m | ||||||||
Low Tide | 5:10PM0.39m | 5:37AM0.20m | 6:06PM0.41m | 6:18AM0.25m | 7:13PM0.42m | 7:07AM0.31m | 8:30PM0.41m | 8:07AM0.36m | 9:51PM0.35m | 9:16AM0.38m | 11:05PM0.25m | 10:26AM0.37m | 00:08AM0.14m | ||||||||
6:46 | — | — | 6:45 | — | — | 6:43 | — | — | 6:43 | — | — | 6:41 | — | — | 6:41 | — | — | 6:39 | — | — | |
— | 5:15 | — | — | 5:15 | — | — | 5:16 | — | — | 5:17 | — | — | 5:19 | — | — | 5:19 | — | — | 5:20 | — | |
mm | — | — | — | — | — | — | — | — | — | — | — | — | — | — | — | — | — | — | — | 1 | — |
Temp °C | 21 | 22 | 16 | 16 | 18 | 12 | 16 | 18 | 12 | 15 | 14 | 13 | 14 | 15 | 14 | 15 | 16 | 16 | 19 | 18 | 14 |
Feels °C | 18 | 19 | 12 | 13 | 15 | 7 | 12 | 15 | 7 | 13 | 10 | 11 | 11 | 14 | 13 | 12 | 12 | 12 | 14 | 12 | 7 |
Swell 1 Height (m) Direction Period (s) | SE 11 | SE 11 | SE 10 | SSW 5 | S 5 | E 6 | E 10 | SSW 5 | SSW 7 | S 8 | S 8 | S 9 | S 9 | S 9 | S 9 | S 8 | S 8 | S 8 | ENE 7 | NE 7 | ENE 8 |
229 | 163 | 68 | 10 | 8 | 3 | 18 | 10 | 73 | 84 | 112 | 132 | 130 | 95 | 94 | 49 | 47 | 19 | 57 | 116 | 100 | |
Swell 2 Height (m) Direction Period (s) | NE 4 | E 15 | NE 5 | SE 10 | ESE 7 | E 11 | E 13 | E 9 | E 12 | E 10 | E 12 | NE 3 | NE 7 | SSE 10 | E 10 | E 8 | E 8 | E 15 | S 8 | ENE 10 | E 14 |
7 | 18 | 8 | 25 | 5 | 10 | 14 | 15 | 11 | 16 | 25 | 3 | 12 | 35 | 29 | 19 | 19 | 5 | 5 | 11 | 15 | |
Swell 3 Height (m) Direction Period (s) | S 21 | NE 7 | E 15 | ESE 7 | SSE 10 | SSE 13 | S 9 | S 9 | E 8 | E 12 | NE 8 | ENE 9 | SSE 10 | ENE 6 | ENE 7 | NE 7 | SSE 9 | SE 14 | E 14 | S 8 | S 8 |
34 | 2 | 4 | 10 | 9 | 16 | 7 | 6 | 5 | 3 | 3 | 16 | 10 | 8 | 5 | 14 | 8 | 7 | 4 | 4 | 1 | |
Wind waves Height (m) Direction Period (s) | NNE 5 | NE 4 | SW 3 | SW 5 | ENE 5 | SW 5 | SW 5 | — | W 4 | — | — | N 4 | SW 2 | — | NE 3 | — | NE 4 | NE 7 | NE 6 | NNW 4 | NW 3 |
12 | 11 | 4 | 19 | 2 | 31 | 23 | — | 7 | — | — | 6 | 1 | — | 2 | — | 12 | 267 | 91 | 9 | 9 | |
Nearest Offshore or Glassy | |||||||||||||||||||||
Distance (km) | 0 | 0 | 0 | 1 | 177 | 2 | 21 | 106 | 1 | 1 | 30 | 1 | 1 | 2 | 1 | 1 | 400 | 28 | 16 | 8 | 62 |
Best forecast wave conditions in Sydney North Coast | |||||||||||||||||||||
Best forecast wave conditions in Australia | |||||||||||||||||||||
Header Global | |||||||||||||||||||||
- Map Icons:
 Break
Break Live Wave Height (m)
 Live Wind Speed (km/h)
 Surf Rating (10 Max)
 Ocean Swells (m)
- Wind Speed (km/h)
Latest Updates


FREE! Surf-Forecast.com widget for your website
The surf report / weather widget below is available to embed on third party websites free of charge and provides a summary of our Freshwater and Harbord surf forecast. Simply grab the html code snippet that we provide and paste it into your own site. You can choose your preferred language and metric/imperial units for the surf forecast feed to suit users of your site. Click here to get the code.
Information about the Freshwater and Harbord Surf forecast
The above surf forecast table for Freshwater and Harbord provides essential information for determining whether the surfing conditions will be good over the next 16 days. A general guide to surfing at Freshwater and Harbord can be found by selecting the local surf guide option on the grey menu. Our Freshwater and Harbord surf forecast is unique since it includes wave energy (power) that defines the real feel of the surf rather than just the height or the period. If you surf the same spot (Freshwater and Harbord) regularly then make a mental note of the wave energy from the surf forecast table each time you go. Very soon you may start to choose your surf days based on the wave energy alone combined with our forecast of favourable offshore wind conditions. Our star ratings will help here and of course you will also find the usual wave height and period predictions on our surf forecasts as well as a full break down of the swell components under our advanced users option (to reveal that, click the little Einstein character under the tide times).
Further information to help with frequently asked questions about our surf forecast for Freshwater and Harbord may be found under the help tab on the top menu and also by moving your mouse over the question marks on the surf forecast table itself. Please always bear in mind that the forecast is for near-shore open water and local factors at each surf break influence the actual breaking wave height, such as the beach / reef profile, water depths offshore and shelter.
Freshwater and Harbord is 4 km (2 miles) from Dee Why. If you plan a holiday in Sydney North Coast, look for hotels and other accommodation in Dee Why. Dee Why has rooms for a wide range of budgets as well as car hire and transport links.
 Nearest