

Surf Forecasts:

Dee Why Point surf forecast from 3 Aug 2026:
- Best quality surf: Monday 3 Aug, 4PM (local time) - 2.5ft (0.8m), 11s period, SE swell with offshore winds.
- Most powerful swell: Sunday 9 Aug, 1AM (local time) - 7ft (2.1m), 7s period, NE swell with 385 kJ wave energy.
- Next surfable swell (1★+): Monday 3 Aug, 4PM (local time) - 2.5ft (0.8m), 11s period with SE swell.
Best Forecast Surf Conditions for Dee Why Point this week:
The surf forecast for Dee Why Point over the next 16 days: The first swell (rated 1 star or higher) is forecast to arrive on Monday (Aug 03) at 4PM. The primary swell is predicted to be 0.8m and 11s period with a secondary swell of 0.4m and 4s. Another secondary swell of 0.8m and 4s is also forecast. The wind is predicted to be offshore as the swell arrives.
The most powerful waves expected at Dee Why Point in the next 16 days are 2.1m 7s and forecast to arrive on Sunday (Aug 09) at 1AM. Winds are predicted to be cross-onshore at the time the swell arrives. The largest open ocean swell (not directed at the beach) is 0.7m 4s period and expected on Wednesday (Aug 05) at 4AM.
| Wave Type | Time (AEST) & Date | Wave Height & Period |
|---|---|---|
| Next good surf (1 star+) | 4PM (Mon 3rd Aug) | 2.5ft (0.8m) 11s |
| Best Surf | 4PM (Mon 3rd Aug) | 2.5ft (0.8m) 11s |
| Most Powerful | 1AM (Sun 9th Aug) | 7ft (2.1m) 7s |
Table - best surf conditions forecast for Dee Why Point over the next 16 days.
The Lowdown
G’day, Rusty here. Look, I’ll be straight with you – the next two weeks are a bit of a mixed bag. We’ve got a long stretch of small, ordinary waves, but there’s a solid pulse of swell arriving right at the end of the forecast that could be a proper standout. Let’s get into it.
Right now, Monday the 3rd of August, it’s pretty flat. The morning is a no-go with a 3ft SE swell and a crosswind messing things up. The afternoon cleans up nicely with a light offshore wind, but the swell drops to 3ft – surfable, but very ordinary. The combined swell energy is weak at 164. Tuesday the 4th is a write-off, with tiny 1.0ft and 0.7ft waves and glassy conditions that don’t save it. Wednesday the 5th is a bit of a tease: the morning has a strong offshore wind, but it’s only 1.0ft. The afternoon goes glassy again, but still only 1ft. Nothing to get excited about.
Thursday the 6th sees a slight bump – 2ft from the south in the morning with clean offshore wind, and the energy jumps to 81. Still weak, but it’s a step in the right direction. Friday the 7th holds similar 3ft waves with a gentle offshore in the morning, and the energy nudges up to 148. It’s surfable, but you’ll be working for it. Saturday the 8th is glassy in the morning with 2ft, and then Sunday the 9th brings a bit more size – 3ft from the ENE – but it’s a messy cross-shore with a cross-chop and a moderate breeze. Not worth paddling out.
The first week is a real grind. There’s a long gap of very ordinary, small surf. But hang on – the second week kicks off with a change. Monday the 10th has a fresh offshore wind, but it’s only 2ft. Tuesday the 11th is a touch better at 3ft from the south with a light cross-offshore breeze, and the energy hits 136. Still ordinary, but clean.
Now, here’s the one to circle. Friday the 14th of August. Dee Why Point fires up with a 10ft swell from the south. The combined swell energy is a massive 2057, which is very strong. The morning has a light cross-shore wind, but it’s a bit rippled. The wave comment says “marginal surf forecast or questionable tide conditions,” but with that much size, it’s going to be one for the experts only – over 8ft is serious. The optimum swell direction for Dee Why Point is SSE, and this is coming from the south, so it’s a good match. The water temp is 63°F, which is about 1°F cooler than normal – nothing wild, just a bit nippy. This is the standout session. The afternoon turns onshore and messy, so get in early.
Saturday the 15th still has some punch – 5ft from the south in the morning with a moderate offshore wind, and the energy is 392. That’s decent, and the conditions are clean. The wave comment says “expect good surf conditions.” It’s not as big as Friday, but it’s still a solid option for the experienced crew. The afternoon drops to 5ft and is a bit lighter. Sunday the 16th has 4ft with a cross-offshore breeze – still surfable, but the energy is dropping.
From Monday the 17th onwards, it’s back to small stuff – 2ft on Monday, then 2ft on Tuesday the 18th with a glassy morning. The window of proper surf is short: Friday the 14th is the big one, and Saturday the 15th is a decent backup. For the rest, you’re looking at a long stretch of tiny, clean waves for the patient soul.
Rusty.
Short Range ForecastMostly dry. Warm (max 22°C on Mon afternoon, min 9°C on Tue night). Wind will be generally light. | Days 4-6 Weather SummaryMostly dry. Very mild (max 16°C on Sat afternoon, min 9°C on Thu night). Wind will be generally light. | ||||||||||||||||||||
Monday 3 | Tuesday 4 | Wednesday 5 | Thursday 6 | Friday 7 | Saturday 8 | Sunday 9 | |||||||||||||||
AM | PM | Night | AM | PM | Night | AM | PM | Night | AM | PM | Night | AM | PM | Night | AM | PM | Night | AM | PM | Night | |
Swell Height Map | 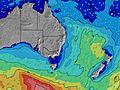 | 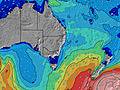 | 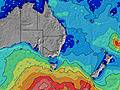 | 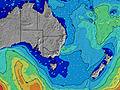 |  |  |  | ||||||||||||||
Wave Height (m) Direction Period (s) | SE 11 | SE 11 | SE 10 | ESE 7 | SSE 10 | E 11 | E 10 | E 9 | S 7 | S 8 | S 9 | S 9 | S 9 | S 9 | S 9 | S 8 | S 8 | NE 7 | ENE 7 | ENE 7 | ENE 8 |
Wave Graph | |||||||||||||||||||||
224 | 134 | 65 | 10 | 9 | 10 | 18 | 27 | 53 | 63 | 41 | 106 | 102 | 103 | 94 | 50 | 33 | 385 | 99 | 81 | 73 | |
Wind (km/h) | |||||||||||||||||||||
Wind State on-shore cross-onshore cross-shore cross-offshore off-shore glassy | cross | off | off | cross-off | glassy | cross-off | off | glassy | off | off | on | cross-off | off | cross | glassy | glassy | on | cross-on | cross | cross | cross-off |
High Tide | 11:17AM1.27m | 11:11PM1.32m | 12:02PM1.30m | 00:00AM1.21m | 12:53PM1.34m | 00:59AM1.10m | 1:52PM1.38m | 2:13AM1.01m | 2:58PM1.43m | 3:38AM0.97m | 4:06PM1.50m | 4:58AM0.99m | 5:10PM1.59m | ||||||||
Low Tide | 5:10PM0.40m | 5:36AM0.20m | 6:06PM0.42m | 6:18AM0.26m | 7:12PM0.44m | 7:07AM0.32m | 8:30PM0.42m | 8:06AM0.37m | 9:51PM0.36m | 9:15AM0.39m | 11:05PM0.26m | 10:25AM0.38m | 00:08AM0.15m | ||||||||
6:46 | — | — | 6:45 | — | — | 6:43 | — | — | 6:43 | — | — | 6:41 | — | — | 6:41 | — | — | 6:39 | — | — | |
— | 5:15 | — | — | 5:15 | — | — | 5:16 | — | — | 5:17 | — | — | 5:19 | — | — | 5:19 | — | — | 5:20 | — | |
mm | — | — | — | — | — | — | — | — | — | — | — | — | — | — | — | — | — | — | — | 1 | — |
Temp °C | 21 | 22 | 16 | 16 | 18 | 12 | 16 | 18 | 13 | 15 | 14 | 13 | 14 | 15 | 14 | 15 | 16 | 16 | 19 | 18 | 14 |
Feels °C | 17 | 18 | 13 | 12 | 15 | 7 | 12 | 15 | 8 | 13 | 10 | 11 | 10 | 14 | 13 | 12 | 13 | 12 | 14 | 13 | 7 |
Swell 1 Height (m) Direction Period (s) | SE 11 | SE 11 | SE 10 | SSW 5 | SSW 5 | SSW 5 | SSW 4 | E 9 | S 7 | S 8 | S 7 | S 9 | S 9 | S 9 | S 9 | S 8 | S 8 | NE 7 | ENE 7 | ENE 7 | ENE 8 |
224 | 134 | 65 | 5 | 3 | 4 | 6 | 27 | 53 | 63 | 38 | 106 | 102 | 103 | 94 | 50 | 33 | 194 | 99 | 81 | 73 | |
Swell 2 Height (m) Direction Period (s) | NE 5 | NE 4 | NE 5 | ESE 7 | ESE 7 | E 6 | E 10 | S 5 | E 8 | E 9 | S 9 | ENE 9 | SE 12 | ENE 7 | ENE 7 | E 8 | E 8 | S 7 | S 8 | S 8 | E 14 |
3 | 5 | 6 | 10 | 5 | 3 | 18 | 5 | 5 | 15 | 41 | 17 | 37 | 9 | 9 | 33 | 19 | 17 | 4 | 4 | 4 | |
Swell 3 Height (m) Direction Period (s) | E 16 | E 15 | E 15 | SSE 10 | SSE 10 | E 11 | E 7 | S 9 | E 10 | E 12 | ENE 9 | ENE 3 | ENE 7 | E 10 | E 10 | SSE 9 | SSE 8 | SSE 8 | E 14 | E 14 | S 8 |
5 | 5 | 4 | 10 | 9 | 10 | 4 | 6 | 8 | 3 | 16 | 1 | 9 | 8 | 7 | 16 | 14 | 7 | 4 | 16 | 1 | |
Wind waves Height (m) Direction Period (s) | NNW 2 | NE 4 | SW 3 | SW 5 | — | WSW 4 | W 3 | — | W 3 | — | NE 2 | — | — | — | NE 3 | — | ENE 3 | NE 7 | NNW 3 | NW 2 | NW 3 |
1 | 20 | 2 | 19 | — | 10 | 5 | — | 2 | — | 1 | — | — | — | 2 | — | 10 | 385 | 3 | 1 | 3 | |
Nearest Offshore or Glassy | |||||||||||||||||||||
Distance (km) | 1 | 0 | 1 | 1 | 174 | 1 | 18 | 109 | 1 | 0 | 33 | 0 | 0 | 3 | 0 | 0 | 397 | 25 | 13 | 5 | 64 |
Best forecast wave conditions in Sydney North Coast | |||||||||||||||||||||
Best forecast wave conditions in Australia | |||||||||||||||||||||
Header Global | |||||||||||||||||||||
- Map Icons:
 Break
Break Live Wave Height (m)
 Live Wind Speed (km/h)
 Surf Rating (10 Max)
 Ocean Swells (m)
- Wind Speed (km/h)
Latest Updates


FREE! Surf-Forecast.com widget for your website
The surf report / weather widget below is available to embed on third party websites free of charge and provides a summary of our Dee Why Point surf forecast. Simply grab the html code snippet that we provide and paste it into your own site. You can choose your preferred language and metric/imperial units for the surf forecast feed to suit users of your site. Click here to get the code.
Information about the Dee Why Point Surf forecast
The above surf forecast table for Dee Why Point provides essential information for determining whether the surfing conditions will be good over the next 16 days. A general guide to surfing at Dee Why Point can be found by selecting the local surf guide option on the grey menu. Our Dee Why Point surf forecast is unique since it includes wave energy (power) that defines the real feel of the surf rather than just the height or the period. If you surf the same spot (Dee Why Point) regularly then make a mental note of the wave energy from the surf forecast table each time you go. Very soon you may start to choose your surf days based on the wave energy alone combined with our forecast of favourable offshore wind conditions. Our star ratings will help here and of course you will also find the usual wave height and period predictions on our surf forecasts as well as a full break down of the swell components under our advanced users option (to reveal that, click the little Einstein character under the tide times).
Further information to help with frequently asked questions about our surf forecast for Dee Why Point may be found under the help tab on the top menu and also by moving your mouse over the question marks on the surf forecast table itself. Please always bear in mind that the forecast is for near-shore open water and local factors at each surf break influence the actual breaking wave height, such as the beach / reef profile, water depths offshore and shelter.
Dee Why Point is 1 km (1 miles) from Dee Why. If you plan a holiday in Sydney North Coast, look for hotels and other accommodation in Dee Why. Dee Why has rooms for a wide range of budgets as well as car hire and transport links.
 Nearest