

Surf Forecasts:

Windang Island surf forecast from 3 Aug 2026:
- Best quality surf: Saturday 8 Aug, 1AM (local time) - 3.5ft (1.1m), 9s period, S swell with offshore winds.
- Most powerful swell: Saturday 8 Aug, 4AM (local time) - 4ft (1.2m), 9s period, S swell with 225 kJ wave energy.
- Next surfable swell (1★+): Tuesday 4 Aug, 1AM (local time) - 2ft (0.6m), 10s period with SE swell.
Best Forecast Surf Conditions for Windang Island this week:
The surf forecast for Windang Island over the next 16 days: The first swell (rated 1 star or higher) is forecast to arrive on Tuesday (Aug 04) at 1AM. The primary swell is predicted to be 0.6m and 10s period with a secondary swell of 0.4m and 5s. The wind is predicted to be offshore as the swell arrives.
The most powerful waves expected at Windang Island in the next 16 days are 1.2m 9s and forecast to arrive on Saturday (Aug 08) at 4AM. Winds are predicted to be offshore at the time the swell arrives. The largest open ocean swell (not directed at the beach) is 0.5m 3s period and expected on Tuesday (Aug 04) at 7AM.
| Wave Type | Time (AEST) & Date | Wave Height & Period |
|---|---|---|
| Next good surf (1 star+) | 1AM (Tue 4th Aug) | 2ft (0.6m) 10s |
| Best Surf | 1AM (Sat 8th Aug) | 3.5ft (1.1m) 9s |
| Most Powerful | 4AM (Sat 8th Aug) | 4ft (1.2m) 9s |
Table - best surf conditions forecast for Windang Island over the next 16 days.
The Lowdown
G’day, Rusty here. Look, I’ll be straight with you—this 16-day window for Windang Island is a tough one. There’s no real standout, no proper session to get excited about. The whole period is a grind of small, weak, and messy surf with barely a moment that’s worth paddling out for. The first week or so is particularly bleak, with days of tiny waves and poor conditions. The only real glimmer comes right at the very end, but it’s a long wait.
Let’s kick off with the first bit of surfable energy on Monday, August 3rd. Windang Island (reef and point) has a small 2ft SE swell, but it’s a short period 10 seconds, so not much push. The water is 65°, which is a touch warmer than average for this time of year – a nice little bonus. The wind is a light cross-offshore, so it’s clean, but the waves are very ordinary. The combined energy is only 126, so it’s weak. Honestly, it’s a scrap.
Tuesday the 4th and Wednesday the 5th are a write-off. Swell drops to 0.7ft and 1.0ft, with strong offshore winds on Tuesday that just flatten everything. Thursday the 6th has a brief moment of glassy conditions on the afternoon with a 2ft S swell, but the period is a short 7 seconds and the energy is only 78. It’s surfable but nothing to drive for.
Friday the 7th through to Sunday the 9th is all poor surf with cross-shore and cross-onshore winds, and the swell stays under 3ft. The energy creeps up to 110 on Sunday afternoon, but it’s a 19 mph cross-offshore wind that’s just too strong for fun waves. Not worth it.
The following week, from Monday the 10th to Sunday the 16th, is more of the same: tiny swell, mostly 1.0ft to 3ft, and the wind is either offshore or cross-offshore, but the waves lack any size or power. The main event on August 11th brings a 4ft NE swell with a moderate cross-onshore wind and a combined energy of 281 – but it’s messy and choppy, so still a pass. The only real change comes on Thursday the 13th, with a 5ft NE swell and a fresh offshore wind, but the period is a shocking 6 seconds, so it’s just lumpy and weak. Energy is 211, but it’s a dud.
Now, the best of a bad bunch – and I mean the only thing close to a highlight – is Tuesday the 18th. That morning, we see a 7ft S swell with a 10-second period and a light cross-shore wind. The combined energy jumps to 840, which is moderate, and the set-up is a bit more solid. But this is a 7ft swell at a reef and point break, so it’s getting into expert territory. The afternoon gets even bigger, with a 8ft S swell and energy of 1447, but it’s a cross-onshore wind, so expect some chop. This is the only time in the whole 16 days you’d even consider it, but it’s a long-range call and not a certainty. For the experienced surfer, that Tuesday morning session might offer clean, powerful waves, but don’t expect perfection.
Overall, it’s a quiet, frustrating run. With the swell being so small and inconsistent for most of the period, the setup doesn’t really suit paddle surfing – if you’re into kite surfing, the stronger winds on some days might be more interesting. Hang in there, forecasts can change.
Rusty.
Short Range ForecastMostly dry. Warm (max 21°C on Mon afternoon, min 9°C on Wed night). Wind will be generally light. | Days 5-7 Weather SummaryMostly dry. Very mild (max 17°C on Thu afternoon, min 9°C on Thu night). Wind will be generally light. | |||||||||||||||||||
Mon 3 | Tuesday 4 | Wednesday 5 | Thursday 6 | Friday 7 | Saturday 8 | Sunday 9 | ||||||||||||||
PM | Night | AM | PM | Night | AM | PM | Night | AM | PM | Night | AM | PM | Night | AM | PM | Night | AM | PM | Night | |
Swell Height Map | 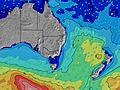 | 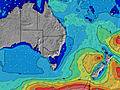 | 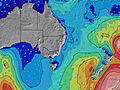 | 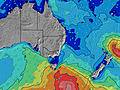 | 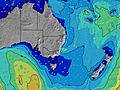 | 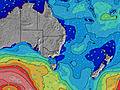 | 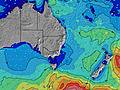 | |||||||||||||
Wave Height (m) Direction Period (s) | SE 10 | SE 10 | SE 10 | SSE 10 | ESE 8 | E 10 | E 9 | S 9 | S 8 | S 7 | S 9 | SSE 9 | SSE 9 | S 9 | S 8 | SE 9 | E 8 | ENE 7 | ENE 8 | ENE 10 |
Wave Graph | ||||||||||||||||||||
102 | 69 | 15 | 10 | 7 | 18 | 15 | 41 | 57 | 39 | 56 | 65 | 47 | 194 | 72 | 30 | 31 | 48 | 88 | 107 | |
Wind (km/h) | ||||||||||||||||||||
Wind State on-shore cross-onshore cross-shore cross-offshore off-shore glassy | cross-off | off | off | off | off | cross-off | cross-off | off | off | glassy | off | cross | cross-on | off | glassy | cross-on | cross-off | cross-off | cross-off | off |
High Tide | 11:14PM1.30m | 12:04PM1.29m | 00:03AM1.20m | 12:54PM1.32m | 1:03AM1.09m | 1:52PM1.36m | 2:17AM1.00m | 2:58PM1.41m | 3:40AM0.97m | 4:05PM1.48m | 4:59AM0.98m | 5:09PM1.57m | ||||||||
Low Tide | 5:12PM0.39m | 5:39AM0.21m | 6:08PM0.41m | 6:20AM0.26m | 7:14PM0.42m | 7:09AM0.32m | 8:31PM0.40m | 8:08AM0.37m | 9:51PM0.34m | 9:16AM0.40m | 11:05PM0.25m | 10:26AM0.38m | 00:08AM0.14m | |||||||
— | — | 6:48 | — | — | 6:47 | — | — | 6:46 | — | — | 6:45 | — | — | 6:43 | — | — | 6:43 | — | — | |
5:15 | — | — | 5:16 | — | — | 5:16 | — | — | 5:17 | — | — | 5:19 | — | — | 5:20 | — | — | 5:20 | — | |
mm | — | — | — | — | — | — | — | — | — | — | — | — | — | — | — | — | — | — | — | — |
Temp °C | 21 | 13 | 17 | 17 | 10 | 16 | 17 | 11 | 16 | 17 | 11 | 15 | 15 | 12 | 15 | 16 | 11 | 17 | 17 | 12 |
Feels °C | 18 | 9 | 11 | 11 | 4 | 14 | 14 | 5 | 13 | 15 | 6 | 11 | 12 | 9 | 11 | 12 | 8 | 11 | 11 | 4 |
Swell 1 Height (m) Direction Period (s) | SE 10 | SE 10 | SE 10 | S 5 | ESE 8 | E 10 | E 9 | S 9 | S 8 | S 7 | S 9 | SSE 9 | SSE 9 | S 9 | S 8 | S 6 | NE 5 | ENE 7 | ENE 8 | ENE 10 |
102 | 69 | 15 | 2 | 7 | 18 | 15 | 41 | 57 | 39 | 56 | 65 | 47 | 194 | 72 | 30 | 11 | 48 | 88 | 107 | |
Swell 2 Height (m) Direction Period (s) | NE 5 | NE 5 | ESE 7 | SSE 10 | SE 11 | S 4 | S 4 | E 8 | E 9 | SSE 10 | SE 10 | E 9 | S 6 | ENE 7 | ENE 8 | E 8 | E 8 | S 8 | S 8 | S 7 |
6 | 7 | 5 | 10 | 5 | 2 | 2 | 6 | 6 | 33 | 25 | 14 | 6 | 10 | 22 | 20 | 31 | 33 | 18 | 4 | |
Swell 3 Height (m) Direction Period (s) | E 16 | E 15 | ENE 5 | ESE 7 | S 5 | E 7 | S 10 | E 12 | E 12 | E 9 | ENE 9 | NE 7 | E 7 | E 10 | SSE 9 | SE 9 | S 8 | ENE 10 | E 15 | E 14 |
5 | 4 | 2 | 5 | 2 | 4 | 9 | 11 | 3 | 6 | 17 | 2 | 9 | 7 | 31 | 20 | 28 | 9 | 4 | 4 | |
Wind waves Height (m) Direction Period (s) | NNE 5 | WSW 3 | WSW 3 | WSW 3 | W 3 | WSW 3 | — | WSW 3 | W 3 | — | WNW 3 | — | SE 2 | — | — | NE 9 | NNW 3 | NNW 3 | NW 3 | WNW 3 |
19 | 3 | 4 | 2 | 5 | 2 | — | 6 | 1 | — | 2 | — | 1 | — | — | 19 | 2 | 3 | 5 | 1 | |
Nearest Offshore or Glassy | ||||||||||||||||||||
Distance (km) | 0 | 0 | 92 | 493 | 362 | 32 | 13 | 2 | 2 | 0 | 0 | 2 | 22 | 0 | 0 | 225 | 7 | 7 | 22 | 15 |
Best forecast wave conditions in Illawarra | ||||||||||||||||||||
Best forecast wave conditions in Australia | ||||||||||||||||||||
Header Global | ||||||||||||||||||||
- Map Icons:
 Break
Break Live Wave Height (m)
 Live Wind Speed (km/h)
 Surf Rating (10 Max)
 Ocean Swells (m)
- Wind Speed (km/h)
Latest Updates


FREE! Surf-Forecast.com widget for your website
The surf report / weather widget below is available to embed on third party websites free of charge and provides a summary of our Windang Island surf forecast. Simply grab the html code snippet that we provide and paste it into your own site. You can choose your preferred language and metric/imperial units for the surf forecast feed to suit users of your site. Click here to get the code.
Information about the Windang Island Surf forecast
The above surf forecast table for Windang Island provides essential information for determining whether the surfing conditions will be good over the next 16 days. A general guide to surfing at Windang Island can be found by selecting the local surf guide option on the grey menu. Our Windang Island surf forecast is unique since it includes wave energy (power) that defines the real feel of the surf rather than just the height or the period. If you surf the same spot (Windang Island) regularly then make a mental note of the wave energy from the surf forecast table each time you go. Very soon you may start to choose your surf days based on the wave energy alone combined with our forecast of favourable offshore wind conditions. Our star ratings will help here and of course you will also find the usual wave height and period predictions on our surf forecasts as well as a full break down of the swell components under our advanced users option (to reveal that, click the little Einstein character under the tide times).
Further information to help with frequently asked questions about our surf forecast for Windang Island may be found under the help tab on the top menu and also by moving your mouse over the question marks on the surf forecast table itself. Please always bear in mind that the forecast is for near-shore open water and local factors at each surf break influence the actual breaking wave height, such as the beach / reef profile, water depths offshore and shelter.
Windang Island is 7 km (4 miles) from the city of Port Kembla. If you plan a holiday in Illawarra, look for hotels and other accommodation in Port Kembla. Port Kembla has rooms for a wide range of budgets as well as car hire and transport links.
 Nearest