

Surf Forecasts:

Nanarup Beach surf forecast from 3 Aug 2026:
- Best quality surf: Saturday 8 Aug, 5PM (local time) - 18ft (5.5m), 16s period, SW swell with cross-shore winds.
- Most powerful swell: Saturday 8 Aug, 5PM (local time) - 18ft (5.5m), 16s period, SW swell with 16,931 kJ wave energy.
- Next surfable swell (1★+): Monday 3 Aug, 8PM (local time) - 4ft (1.2m), 16s period with SSW swell.
Best Forecast Surf Conditions for Nanarup Beach this week:
The surf forecast for Nanarup Beach over the next 16 days: The first swell (rated 1 star or higher) is forecast to arrive on Monday (Aug 03) at 8PM. The primary swell is predicted to be 1.2m and 16s period with a secondary swell of 0.8m and 6s. The wind is predicted to be offshore as the swell arrives.
The most powerful waves expected at Nanarup Beach in the next 16 days are 5.5m 16s and forecast to arrive on Saturday (Aug 08) at 5PM. Winds are predicted to be cross-shore at the time the swell arrives. The largest open ocean swell (not directed at the beach) is 1.2m 5s period and expected on Tuesday (Aug 04) at 11AM.
| Wave Type | Time (AWST) & Date | Wave Height & Period |
|---|---|---|
| Next good surf (1 star+) | 8PM (Mon 3rd Aug) | 4ft (1.2m) 16s |
| Best Surf | 5PM (Sat 8th Aug) | 18ft (5.5m) 16s |
| Most Powerful | 5PM (Sat 8th Aug) | 18ft (5.5m) 16s |
Table - best surf conditions forecast for Nanarup Beach over the next 16 days.
The Lowdown
Alright folks, Rusty here. Let’s have a look at what’s cooking for Nanarup Beach over the next couple of weeks.
We’ve got a solid run of surf ahead, but the first day, Monday the 3rd of August, is actually a bit of a tease. The swell is a modest 4 ft from the SSW with a long 16-second period, and the water is sitting at 64°, which is a touch warmer than normal for this time of year. The wind is light offshore from the NNW, so it’s clean, but the energy is moderate (735). It’s a decent start, but the real action doesn’t kick off until the next day.
Tuesday the 4th sees a jump in size to 6 ft–7 ft from the SSW, still with that long period, but the wind swings cross-offshore from the west, and the combined energy rockets up (2453). The forecast notes tidal concerns, so it’s a bit of a mixed bag. Wednesday morning the 5th is where it gets interesting. We’ve got 8 ft SSW swell, a 16-second period, and glassy conditions with a light southerly breeze. This is the best of the first week for experienced surfers. The energy is strong (3276), and those early morning waves are going to be clean and lined up. The afternoon gets a bit cross, so aim for the dawn patrol.
Thursday the 6th holds well with 7 ft SSW swell, clean lines, and offshore winds from the NW in the morning, dropping to a gentle cross-off in the afternoon. Energy is still strong (2445). Friday the 7th stays similar in size but the wind is more cross-off, and the quality is a notch down. The weekend brings a big change. Saturday the 8th sees a massive spike to 15 ft–18 ft from the SW, with energy through the roof (16295 – 24609). This is huge, unsurfable for most, and the wind is cross. This is more of a kite-surfing setup than a paddle session. Sunday the 9th drops back to 12 ft, but the wind is still cross-off, and the energy is still hefty (7259). It’s big and powerful, not for the faint-hearted.
The following week, from Monday the 10th onwards, the swell stays big, around 12 ft–18 ft, with strong winds and messy conditions. Tuesday the 11th is a write-off with 16 ft+ swell and strong onshore winds – poor surf. Wednesday the 12th is also too big at 18 ft, despite favorable wind. Things start to settle down on Thursday the 13th with 10 ft S swell, but it’s still cross and lumpy. Friday the 14th drops to 6 ft, then 3 ft, with a very long 20-second period, but the wind is light cross-onshore.
Now, the standout in the second week is Saturday the 15th of August. The morning offers 6 ft SSW swell, a 16-second period, and glassy conditions with a light NNE breeze. The energy is strong (2506), and the water is still clean. This is a proper gem for experienced surfers. Sunday the 16th and Monday the 17th continue the trend with clean offshore winds from the NNW, 5 ft–5 ft SSW swell, and gentle conditions. The energy is moderate but steady. The pattern holds into Tuesday the 18th, with a 6 ft SSW swell and a long 18-second period, and clean offshore wind. This whole stretch from the 15th to the 18th is the pick of the outlook – consistent, clean, and manageable.
Remember, Nanarup Beach is a beginner-friendly spot, but when the swell goes over 8 ft, it’s only for the experts. Crowds are sometimes an issue, so keep an eye out. The water stays a touch warmer than average for August.
Rusty, signing off.
Short Range ForecastLight rain (total 4mm), mostly falling on Wed morning. Warm (max 21°C on Mon afternoon, min 11°C on Wed morning). Wind will be generally light. | Days 5-7 Weather SummaryModerate rain (total 16mm), heaviest on Fri night. Very mild (max 18°C on Thu afternoon, min 11°C on Thu night). Winds increasing (light winds from the NW on Thu night, strong winds from the SW by Fri night). | |||||||||||||||||||
Mon 3 | Tuesday 4 | Wednesday 5 | Thursday 6 | Friday 7 | Saturday 8 | Sunday 9 | ||||||||||||||
PM | Night | AM | PM | Night | AM | PM | Night | AM | PM | Night | AM | PM | Night | AM | PM | Night | AM | PM | Night | |
Swell Height Map | 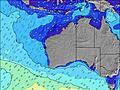 | 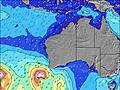 | 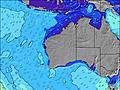 | 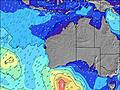 | 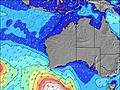 | 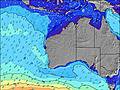 | 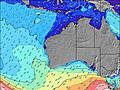 | |||||||||||||
Wave Height (m) Direction Period (s) | SSW 16 | SSW 15 | SSW 18 | SSW 17 | SSW 16 | SSW 16 | SSW 16 | SSW 16 | SSW 16 | SSW 16 | SSW 16 | SSW 16 | SSW 16 | SSW 15 | SSW 15 | SW 16 | SSW 17 | SSW 16 | SSW 16 | SSW 16 |
Wave Graph | ||||||||||||||||||||
561 | 604 | 2369 | 2225 | 1137 | 3175 | 3460 | 2354 | 2445 | 2187 | 2620 | 2186 | 2682 | 4230 | 9304 | 16931 | 7280 | 5820 | 5903 | 6152 | |
Wind (km/h) | ||||||||||||||||||||
Wind State on-shore cross-onshore cross-shore cross-offshore off-shore glassy | off | off | cross-off | cross-off | cross-off | glassy | cross | off | off | cross-off | off | cross-off | cross-off | cross | cross | cross | cross-off | cross-off | cross-off | cross-off |
High Tide | 1:37AM0.53m | 12:21PM0.47m | 2:18AM0.57m | 3:29AM0.61m | 6:01AM0.66m | 7:34AM0.75m | 8:34AM0.83m | |||||||||||||
Low Tide | 7:10PM0.20m | 7:31AM0.35m | 6:59PM0.23m | 6:09PM0.22m | 4:54PM0.16m | 4:37PM0.06m | 4:52PM-0.02m | 5:19PM-0.07m | ||||||||||||
— | — | 7:00 | — | — | 6:58 | — | — | 6:58 | — | — | 6:56 | — | — | 6:56 | — | — | 6:54 | — | — | |
5:27 | — | — | 5:27 | — | — | 5:28 | — | — | 5:29 | — | — | 5:30 | — | — | 5:30 | — | — | 5:30 | — | |
mm | — | — | 1 | — | — | 2 | 1 | — | — | 1 | — | — | 4 | 10 | — | — | — | 1 | 2 | 2 |
Temp °C | 21 | 17 | 14 | 15 | 14 | 12 | 14 | 14 | 16 | 18 | 15 | 15 | 17 | 13 | 12 | 13 | 12 | 13 | 15 | 13 |
Feels °C | 17 | 14 | 9 | 10 | 9 | 11 | 12 | 12 | 11 | 14 | 13 | 12 | 13 | 6 | 4 | 6 | 6 | 9 | 9 | 9 |
Swell 1 Height (m) Direction Period (s) | SSW 16 | SSW 15 | SSW 18 | SSW 17 | SSW 16 | SSW 16 | SSW 16 | SSW 16 | SSW 16 | SSW 16 | SSW 16 | SSW 16 | SSW 16 | — | SSW 16 | SSW 16 | SSW 17 | SSW 16 | SSW 16 | SSW 16 |
561 | 604 | 2369 | 2225 | 1137 | 3175 | 3460 | 2354 | 2445 | 2187 | 2620 | 2186 | 2682 | — | 6991 | 7678 | 7280 | 5820 | 5903 | 6152 | |
Swell 2 Height (m) Direction Period (s) | E 6 | E 7 | E 8 | E 8 | SW 8 | SW 8 | — | SSW 8 | — | W 7 | — | — | — | — | — | — | — | SSW 17 | SW 21 | SW 20 |
38 | 58 | 78 | 41 | 84 | 90 | — | 109 | — | 83 | — | — | — | — | — | — | — | 1439 | 224 | 455 | |
Swell 3 Height (m) Direction Period (s) | SSE 8 | SSW 21 | SSE 8 | SSE 8 | E 8 | E 8 | — | — | — | — | — | — | — | — | — | — | — | — | — | — |
26 | 253 | 6 | 6 | 18 | 11 | — | — | — | — | — | — | — | — | — | — | — | — | — | — | |
Wind waves Height (m) Direction Period (s) | ENE 6 | WNW 3 | WSW 5 | WSW 5 | WNW 3 | — | E 8 | — | — | — | — | SW 8 | WSW 6 | SSW 15 | SSW 15 | SW 16 | — | W 4 | — | NW 4 |
110 | 1 | 73 | 37 | 4 | — | 4 | — | — | — | — | 67 | 132 | 4230 | 9304 | 16931 | — | 13 | — | 4 | |
Nearest Offshore or Glassy | ||||||||||||||||||||
Distance (km) | 0 | 0 | 692 | 226 | 15 | 0 | 17 | 0 | 0 | 0 | 0 | 61 | 1518 | 1423 | 290 | 312 | 92 | 92 | 890 | 61 |
Best forecast wave conditions in Far South of Western Australia | ||||||||||||||||||||
Best forecast wave conditions in Australia | ||||||||||||||||||||
Header Global | ||||||||||||||||||||
- Map Icons:
 Break
Break Live Wave Height (m)
 Live Wind Speed (km/h)
 Surf Rating (10 Max)
 Ocean Swells (m)
- Wind Speed (km/h)
Latest Updates


FREE! Surf-Forecast.com widget for your website
The surf report / weather widget below is available to embed on third party websites free of charge and provides a summary of our Nanarup Beach surf forecast. Simply grab the html code snippet that we provide and paste it into your own site. You can choose your preferred language and metric/imperial units for the surf forecast feed to suit users of your site. Click here to get the code.
Information about the Nanarup Beach Surf forecast
The above surf forecast table for Nanarup Beach provides essential information for determining whether the surfing conditions will be good over the next 16 days. A general guide to surfing at Nanarup Beach can be found by selecting the local surf guide option on the grey menu. Our Nanarup Beach surf forecast is unique since it includes wave energy (power) that defines the real feel of the surf rather than just the height or the period. If you surf the same spot (Nanarup Beach) regularly then make a mental note of the wave energy from the surf forecast table each time you go. Very soon you may start to choose your surf days based on the wave energy alone combined with our forecast of favourable offshore wind conditions. Our star ratings will help here and of course you will also find the usual wave height and period predictions on our surf forecasts as well as a full break down of the swell components under our advanced users option (to reveal that, click the little Einstein character under the tide times).
Further information to help with frequently asked questions about our surf forecast for Nanarup Beach may be found under the help tab on the top menu and also by moving your mouse over the question marks on the surf forecast table itself. Please always bear in mind that the forecast is for near-shore open water and local factors at each surf break influence the actual breaking wave height, such as the beach / reef profile, water depths offshore and shelter.
Nanarup Beach is 11 km (7 miles) from Albany. If you plan a holiday in Far South of Western Australia, look for hotels and other accommodation in Albany. Albany has rooms for a wide range of budgets as well as car hire and transport links.
 Nearest