

Surf Forecasts:

Slip Point (Clallam Bay) surf forecast from 3 Aug 2026:
- Best quality surf: Tuesday 4 Aug, 2PM (local time) - 2.5ft (0.7m), 7s period, W swell with cross-offshore winds.
- Most powerful swell: Sunday 9 Aug, 2AM (local time) - 4.5ft (1.3m), 8s period, W swell with 206 kJ wave energy.
- Next surfable swell (1★+): Tuesday 4 Aug, 2PM (local time) - 2.5ft (0.7m), 7s period with W swell.
Best Forecast Surf Conditions for Slip Point (Clallam Bay) this week:
The surf forecast for Slip Point (Clallam Bay) over the next 16 days: The first swell (rated 1 star or higher) is forecast to arrive on Tuesday (Aug 04) at 2PM. The primary swell is predicted to be 0.7m and 7s period with a secondary swell of 0.4m and 9s. The wind is predicted to be cross-offshore as the swell arrives.
The most powerful waves expected at Slip Point (Clallam Bay) in the next 16 days are 1.3m 8s and forecast to arrive on Sunday (Aug 09) at 2AM. Winds are predicted to be cross-shore at the time the swell arrives. The largest open ocean swell (not directed at the beach) is 1.1m 7s period and expected on Saturday (Aug 08) at 11PM.
| Wave Type | Time (PDT) & Date | Wave Height & Period |
|---|---|---|
| Next good surf (1 star+) | 2PM (Tue 4th Aug) | 2.5ft (0.7m) 7s |
| Best Surf | 2PM (Tue 4th Aug) | 2.5ft (0.7m) 7s |
| Most Powerful | 2AM (Sun 9th Aug) | 4.5ft (1.3m) 8s |
Table - best surf conditions forecast for Slip Point (Clallam Bay) over the next 16 days.
The Lowdown
Alright folks, Rusty here. Let’s have a look at what’s cookin’ for the next couple of weeks.
Right off the bat, I gotta be honest with you – this is a pretty grim stretch for Slip Point (Clallam Bay). There’s a big, quiet gap at the start. From now until the morning of Wednesday, August 5th, there’s just nothing worth paddling out for. The energy is a big fat zero. You’re looking at flat, clean mornings with light easterly cross-off winds, but no swell to push you around. Just a whole lot of nothing.
Things finally get a tiny pulse on Wednesday morning, August 5th. We’ve got a weak 3ft swell from the west, with a short period of 8 seconds. The combined energy is pretty weak at 144 (moderate), and the conditions are described as “surfable but very ordinary.” The wind is light and cross-offshore from the east, so it’ll be clean, but honestly, the waves are gonna be small and gutless. It’s a beginner-friendly size, but not much fun for anyone else. That afternoon, the wind goes glassy, but the swell completely shuts off again.
Then we hit another dry spell. From Thursday, August 6th, right through to Sunday, August 9th, it’s a flat zone. A few days of clean mornings and onshore afternoons, but no swell to speak of.
The next blip on the radar is Monday morning, August 10th. We see a 4ft west swell with a period of 9 seconds, and the combined energy bumps up to 186 (moderate). The wind is a light cross-off from the east-northeast, making it clean. Again, it’s small and ordinary, but it’s the pick of a very poor bunch. That afternoon, the wind swings onshore from the northwest and ruins it.
After that, it’s a long, slow fade into nothing. Tuesday the 11th through to the end of the forecast window on Tuesday, August 18th, is mostly flat. There’s a tiny pulse of 3ft on the afternoon of Saturday, August 15th, but with onshore wind and a combined energy of 147 (moderate), it’s poor.
The only true standout, if you can call it that, is the morning of Wednesday, August 5th. It’s clean, the swell is just about surfable, but it’s fleeting. The rest of the window is a write-off. For a spot that’s fairly exposed, this is a real bummer. The water temperature is about average for this time of year, so no surprises there.
Keep your eyes on the forecasts, though. It tends not to stay this flat forever.
Rusty.
Short Range ForecastMostly dry. Warm (max 22°C on Tue afternoon, min 12°C on Sun night). Wind will be generally light. | Days 5-7 Weather SummaryMostly dry. Warm (max 21°C on Thu afternoon, min 12°C on Thu night). Wind will be generally light. | ||||||||||||||||||
Monday 3 | Tuesday 4 | Wednesday 5 | Thursday 6 | Friday 7 | Saturday 8 | ||||||||||||||
Night | AM | PM | Night | AM | PM | Night | AM | PM | Night | AM | PM | Night | AM | PM | Night | AM | PM | Night | |
Swell Height Map | 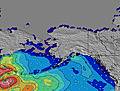 | 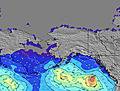 | 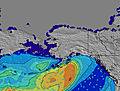 | 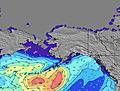 | 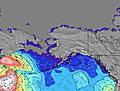 | 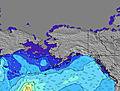 | 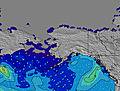 | ||||||||||||
Wave Height (m) Direction Period (s) | W 8 | W 7 | W 7 | W 7 | W 7 | W 9 | W 9 | W 8 | W 8 | WNW 8 | W 8 | W 8 | W 8 | W 7 | W 7 | W 7 | W 7 | W 7 | W 8 |
Wave Graph | |||||||||||||||||||
0 | 0 | 0 | 0 | 0 | 39 | 0 | 144 | 0 | 112 | 0 | 0 | 0 | 0 | 0 | 0 | 0 | 0 | 206 | |
Wind (km/h) | |||||||||||||||||||
Wind State on-shore cross-onshore cross-shore cross-offshore off-shore glassy | glassy | cross-off | cross-on | glassy | cross-off | cross-on | glassy | cross-off | glassy | cross-on | cross-off | on | cross-on | on | cross-on | cross | glassy | cross-on | cross |
High Tide | 4:19AM3.58m | 5:21PM3.97m | 5:22AM3.39m | 5:48PM4.08m | 6:45AM3.23m | 6:21PM4.18m | 8:35AM3.16m | 7:04PM4.25m | 10:34AM3.23m | 7:59PM4.31m | 11:58AM3.37m | 9:03PM4.35m | |||||||
Low Tide | 11:03PM2.61m | 10:38AM2.16m | 00:03AM2.48m | 11:00AM2.44m | 1:06AM2.32m | 11:25AM2.72m | 2:13AM2.14m | 11:58AM2.97m | 3:23AM1.93m | 12:50PM3.18m | 4:30AM1.71m | 2:25PM3.30m | |||||||
— | 5:54 | — | — | 5:54 | — | — | 5:56 | — | — | 5:58 | — | — | 5:58 | — | — | 6:01 | — | — | |
8:52 | — | 8:51 | — | — | 8:49 | — | — | 8:47 | — | — | 8:45 | — | — | 8:44 | — | — | 8:43 | — | |
mm | — | — | — | — | — | — | — | — | — | — | — | — | — | — | — | — | — | — | — |
Temp °C | 15 | 17 | 19 | 16 | 20 | 22 | 18 | 20 | 22 | 18 | 20 | 21 | 17 | 18 | 21 | 16 | 18 | 20 | 16 |
Feels °C | 13 | 14 | 17 | 15 | 18 | 20 | 17 | 18 | 21 | 18 | 19 | 19 | 16 | 17 | 18 | 14 | 18 | 19 | 15 |
Swell 1 Height (m) Direction Period (s) | W 8 | W 7 | W 7 | W 7 | W 7 | W 7 | W 9 | W 8 | W 8 | WNW 8 | W 8 | W 8 | W 8 | W 7 | W 7 | W 7 | W 7 | W 7 | W 8 |
125 | 85 | 50 | 46 | 62 | 38 | 122 | 144 | 108 | 112 | 86 | 80 | 72 | 66 | 48 | 62 | 88 | 88 | 206 | |
Swell 2 Height (m) Direction Period (s) | SW 13 | SW 13 | SW 13 | SSW 13 | WSW 16 | W 9 | WSW 15 | WSW 15 | WSW 15 | SW 14 | SW 14 | SW 14 | SW 13 | SW 13 | SW 13 | SW 13 | SW 13 | W 13 | SW 12 |
28 | 28 | 27 | 17 | 25 | 39 | 23 | 21 | 21 | 31 | 31 | 29 | 28 | 27 | 27 | 26 | 25 | 30 | 25 | |
Swell 3 Height (m) Direction Period (s) | SW 18 | WSW 18 | SW 18 | WSW 16 | SW 13 | WSW 16 | SW 12 | SW 12 | SW 12 | W 18 | W 13 | W 16 | W 13 | W 15 | W 12 | W 13 | W 13 | SW 12 | W 12 |
12 | 31 | 12 | 26 | 7 | 25 | 6 | 6 | 6 | 6 | 14 | 5 | 13 | 17 | 11 | 13 | 14 | 24 | 12 | |
Wind waves Height (m) Direction Period (s) | — | — | — | — | — | — | — | — | — | — | — | — | — | — | — | — | — | — | — |
— | — | — | — | — | — | — | — | — | — | — | — | — | — | — | — | — | — | — | |
Nearest Offshore or Glassy | |||||||||||||||||||
Distance (km) | 17 | 22 | 27 | 22 | 22 | 27 | 17 | 0 | 22 | 17 | 17 | 131 | 17 | 17 | 918 | 17 | 17 | 17 | 14 |
Best forecast wave conditions in Washington State | |||||||||||||||||||
Best forecast wave conditions in United States | |||||||||||||||||||
Header Global | |||||||||||||||||||
- Map Icons:
 Break
Break Live Wave Height (m)
 Live Wind Speed (km/h)
 Surf Rating (10 Max)
 Ocean Swells (m)
- Wind Speed (km/h)
Latest Updates


FREE! Surf-Forecast.com widget for your website
The surf report / weather widget below is available to embed on third party websites free of charge and provides a summary of our Slip Point (Clallam Bay) surf forecast. Simply grab the html code snippet that we provide and paste it into your own site. You can choose your preferred language and metric/imperial units for the surf forecast feed to suit users of your site. Click here to get the code.
Information about the Slip Point (Clallam Bay) Surf forecast
The above surf forecast table for Slip Point (Clallam Bay) provides essential information for determining whether the surfing conditions will be good over the next 16 days. A general guide to surfing at Slip Point (Clallam Bay) can be found by selecting the local surf guide option on the grey menu. Our Slip Point (Clallam Bay) surf forecast is unique since it includes wave energy (power) that defines the real feel of the surf rather than just the height or the period. If you surf the same spot (Slip Point (Clallam Bay)) regularly then make a mental note of the wave energy from the surf forecast table each time you go. Very soon you may start to choose your surf days based on the wave energy alone combined with our forecast of favourable offshore wind conditions. Our star ratings will help here and of course you will also find the usual wave height and period predictions on our surf forecasts as well as a full break down of the swell components under our advanced users option (to reveal that, click the little Einstein character under the tide times).
Further information to help with frequently asked questions about our surf forecast for Slip Point (Clallam Bay) may be found under the help tab on the top menu and also by moving your mouse over the question marks on the surf forecast table itself. Please always bear in mind that the forecast is for near-shore open water and local factors at each surf break influence the actual breaking wave height, such as the beach / reef profile, water depths offshore and shelter.
 Nearest