


Surf Forecasts:
How big are the waves at Mumba Point today (20 Oct):
- Morning surf: Morning surf (20 Oct, local time) - 2.5ft (0.7m), 12s period with SSW swell.
- Afternoon surf: Afternoon surf (20 Oct, local time) - 3ft (0.9m), 12s period with S swell.
- Evening surf: Evening surf (20 Oct, local time) - 2.5ft (0.8m), 11s period with S swell.
The current surf forecast for Mumba Point at 6PM is: 0.6m 15s primary swell from a South direction and 0.7m 12s secondary swell from a South direction (forecast issued at 11:00am October 20). The wind direction is predicted to be cross-offshore and the swell rating is 2.
| Time (GMT) & Date | Wave Height | Wave Period |
|---|---|---|
| Morning (20 Oct) | 2.5ft (0.7m) | 12s |
| Afternoon (20 Oct) | 3ft (0.9m) | 12s |
| Evening (20 Oct) | 2.5ft (0.8m) | 11s |
Table - waves today at Mumba Point. (Swell directed towards the surf break)
Short Range ForecastModerate rain (total 16mm), heaviest on Tue night. Warm (max 28°C on Tue afternoon, min 26°C on Tue morning). Wind will be generally light. | |||||||||||||||||||||
Tue 20 | Wednesday 21 | Thursday 22 | |||||||||||||||||||
9 AM | 12 PM | 3 PM | 6 PM | 9 PM | 12 AM | 3 AM | 6 AM | 9 AM | 12 PM | 3 PM | 6 PM | 9 PM | 12 AM | 3 AM | 6 AM | 9 AM | 12 PM | 3 PM | 6 PM | 9 PM | |
Swell Height Map |  |  |  |  |  |  |  | 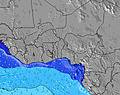 | |||||||||||||
Wave Height (m) Direction Period (s) | SSW 12 | SSW 12 | S 12 | S 15 | S 11 | S 14 | S 13 | S 13 | S 13 | S 13 | S 12 | S 12 | S 12 | S 12 | S 12 | S 12 | S 12 | S 12 | S 11 | S 11 | S 11 |
Wave Graph  | |||||||||||||||||||||
 kJ | 147 | 142 | 220 | 153 | 163 | 180 | 173 | 170 | 411 | 398 | 368 | 295 | 290 | 280 | 280 | 276 | 273 | 325 | 308 | 282 | 224 |
Wind (km/h) | |||||||||||||||||||||
Wind State on-shore cross-onshore cross-shore cross-offshore off-shore glassy | glassy | cross-off | cross-off | cross-off | cross | cross-on | cross-on | cross-on | glassy | cross | cross | cross | cross | cross | glassy | glassy | glassy | cross | cross | cross | cross |
High Tide | 2:48PM0.87m | 3:06AM1.09m | 3:38PM0.95m | 3:48AM1.16m | 4:18PM1.04m | ||||||||||||||||
Low Tide | 8:37AM0.50m | 8:19PM0.48m | 9:25AM0.42m | 9:15PM0.42m | 10:04AM0.32m | ||||||||||||||||
 | | |  |  |  |  |  | | | |  | | | | | | | | | | |
 | 6:28 | — | — | — | — | — | — | 6:28 | — | — | — | — | — | — | — | 6:28 | — | — | — | — | — |
 | — | — | — | 6:25 | — | — | — | — | — | — | — | 6:25 | — | — | — | — | — | — | — | 6:25 | — |
mm | 1 | 1 | 1 | — | — | — | 4 | — | — | 2 | 1 | — | — | — | 2 | 1 | — | — | — | — | 1 |
Temp °C | 26 | 27 | 28 | 27 | 27 | 27 | 26 | 26 | 27 | 27 | 28 | 27 | 27 | 26 | 26 | 26 | 26 | 28 | 28 | 27 | 27 |
Feels °C | 31 | 31 | 31 | 30 | 31 | 31 | 30 | 30 | 32 | 30 | 31 | 30 | 30 | 30 | 31 | 31 | 31 | 31 | 30 | 30 | 31 |
Swell 1 Height (m) Direction Period (s) | SSW 12 | SSW 12 | S 12 | S 12 | S 11 | S 11 | S 11 | S 11 | S 13 | S 13 | S 12 | S 12 | S 12 | S 12 | S 12 | S 12 | S 12 | S 12 | S 11 | S 11 | S 11 |
| kJ | 147 | 142 | 220 | 132 | 163 | 157 | 157 | 151 | 411 | 398 | 368 | 295 | 290 | 280 | 280 | 276 | 273 | 325 | 308 | 282 | 224 |
Swell 2 Height (m) Direction Period (s) | S 6 | S 6 | S 15 | S 15 | S 14 | S 14 | S 13 | S 13 | S 6 | S 6 | S 6 | SSE 7 | SSE 6 | — | — | SSE 7 | SE 6 | — | — | — | SW 18 |
| kJ | 22 | 15 | 155 | 153 | 148 | 180 | 173 | 170 | 22 | 20 | 22 | 5 | 4 | — | — | 5 | 6 | — | — | — | 12 |
Swell 3 Height (m) Direction Period (s) | S 16 | S 15 | S 7 | S 7 | S 7 | S 7 | S 7 | S 7 | — | — | — | — | — | — | — | — | — | — | S 18 | W 10 | W 10 |
| kJ | 80 | 116 | 22 | 21 | 23 | 23 | 22 | 22 | — | — | — | — | — | — | — | — | — | — | 6 | 2 | 2 |
Wind waves Height (m) Direction Period (s) | — | — | — | — | — | — | — | — | — | — | — | WSW 4 | — | — | — | — | — | — | — | — | — |
| kJ | — | — | — | — | — | — | — | — | — | — | — | 1 | — | — | — | — | — | — | — | — | — |
Nearest Offshore or Glassy | |||||||||||||||||||||
Distance (km) | 0 | 0 | 0 | 0 | 470 | 470 | 110 | 18 | 0 | 285 | 964 | 285 | 285 | 285 | 0 | 0 | 0 | 1135 | 972 | 964 | 470 |
Best forecast wave conditions in Liberia | |||||||||||||||||||||
Best forecast wave conditions in Liberia | |||||||||||||||||||||
Header Global | |||||||||||||||||||||
- Map Icons:
 Break
 Live Wave Height (m)
 Live Wind Speed (km/h)
 Surf Rating (10 Max)
 Ocean Swells (m)
- Wind Speed (km/h)


FREE! Surf-Forecast.com widget for your website
The surf report / weather widget below is available to embed on third party websites free of charge and provides a summary of our Mumba Point surf forecast. Simply grab the html code snippet that we provide and paste it into your own site. You can choose your preferred language and metric/imperial units for the surf forecast feed to suit users of your site. Click here to get the code.

 Nearest