
Today's St Laurent du Var sea temperature is 22.2 °C
(3.3°C warmer than normal for this time of year)
| Mean: | 18.9 °C | ||||||||||||||||||||||||||||||||||||||||||||||||||||||||||||||||||||||||||||||||||||||||||||||||||
|---|---|---|---|---|---|---|---|---|---|---|---|---|---|---|---|---|---|---|---|---|---|---|---|---|---|---|---|---|---|---|---|---|---|---|---|---|---|---|---|---|---|---|---|---|---|---|---|---|---|---|---|---|---|---|---|---|---|---|---|---|---|---|---|---|---|---|---|---|---|---|---|---|---|---|---|---|---|---|---|---|---|---|---|---|---|---|---|---|---|---|---|---|---|---|---|---|---|---|---|
| Range: | 16.4 °C to 23.4 °C | ||||||||||||||||||||||||||||||||||||||||||||||||||||||||||||||||||||||||||||||||||||||||||||||||||
| Statistics for 08 Jun (1981–2005) | |||||||||||||||||||||||||||||||||||||||||||||||||||||||||||||||||||||||||||||||||||||||||||||||||||
Today, many surfers would wear a shorty .
Sunny with pleasantly warm air temperatures (feeling like 22 °C once we account for wind), and similar sea temperatures (22 °C). Wear boardshorts or a shorty, or better still a thin summer wetsuit to keep the UV off.
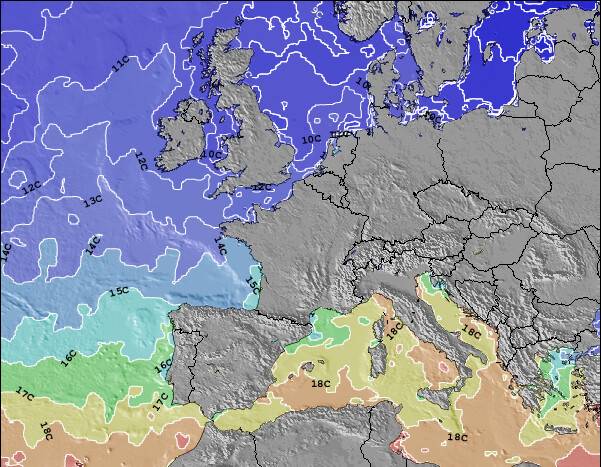 Map of current France Surface Water Temperatures (based on measurements from oceanographic satellites) | 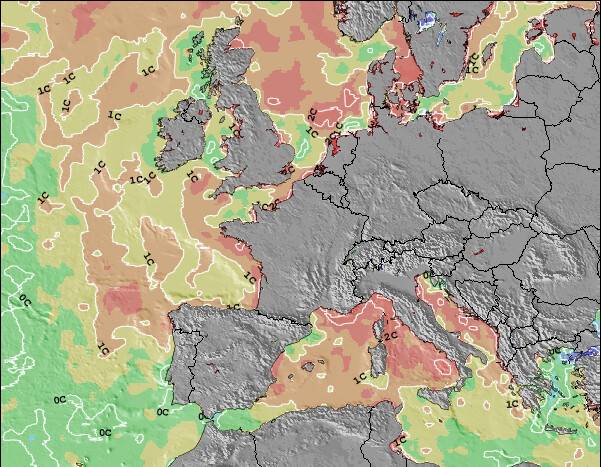 Map of current France Sea Water Temperature Anomalies (compared with long term averages at this time of year) |
click thumbnails to expand
Below is a graph of Historical Sea Surface Temperature for St Laurent du Var. This has been derived from analysis of two decades of oceanographic satellite measurements of nearby open water. We have calculated the average water temperature variation around the year as well as the extremes that have been observed on each date.

All of the graphs for the surf breaks presented on Surf-Forecast.com are on the same scale to enable comparison between locations around the world.
St Laurent du Var sea temperatures peak in the range 22 to 27°C (72 to 81°F) on around the 16th of August and are at their lowest on about the 1st of March, at 13°C. St Laurent du Var sea temperatures are always warm reach their highest in the middle of August. You'll need a 2mm neoprene top or a shorty at dawn/dusk or if it's windy. The lowest sea temperatures at St Laurent du Var at the beginning of March are ideally suited to a 4/3mm wetsuit + 3mm boots, although a 5/3mm wetsuit may be preferable for longer sessions and cold windy days.
Actual sea surface water temperatures close to shore at St Laurent du Var can vary by several degrees compared with these open water averages. This is especially true after heavy rain, close to river mouths or after long periods of strong offshore winds. Offshore winds cause colder deep water to replace surface water that has been warmed by the sun. Air temperature, wind-chill and sunshine should also be considered before deciding on the kind of wetsuit needed to stay warm when surfing at St Laurent du Var. Refer to our detailed weather forecasts for this information.
 Nearest