
Today's La Coronilla sea temperature is 15.1 °C
(Slightly warmer than usual)
| Mean: | 14.4 °C | ||||||||||||||||||||||||||||||||||||||||||||||||||||||||||||||||||||||||||||||||||||||||||||||||||
|---|---|---|---|---|---|---|---|---|---|---|---|---|---|---|---|---|---|---|---|---|---|---|---|---|---|---|---|---|---|---|---|---|---|---|---|---|---|---|---|---|---|---|---|---|---|---|---|---|---|---|---|---|---|---|---|---|---|---|---|---|---|---|---|---|---|---|---|---|---|---|---|---|---|---|---|---|---|---|---|---|---|---|---|---|---|---|---|---|---|---|---|---|---|---|---|---|---|---|---|
| Range: | 11.9 °C to 16.2 °C | ||||||||||||||||||||||||||||||||||||||||||||||||||||||||||||||||||||||||||||||||||||||||||||||||||
| Statistics for 10 Jun (1981–2005) | |||||||||||||||||||||||||||||||||||||||||||||||||||||||||||||||||||||||||||||||||||||||||||||||||||
Today, many surfers would wear a spring wetsuit, neoprene gloves and boots.
The water temperature (15 °C) at La Coronilla is quite cool. If the sun does come out as forecast, it should feel warm enough to surf in a good sealed spring wetsuit. Some surfers would prefer to wear gloves and boots too. Effective windchill factor of (13 °C) will make the air and water feel about the same temperature.
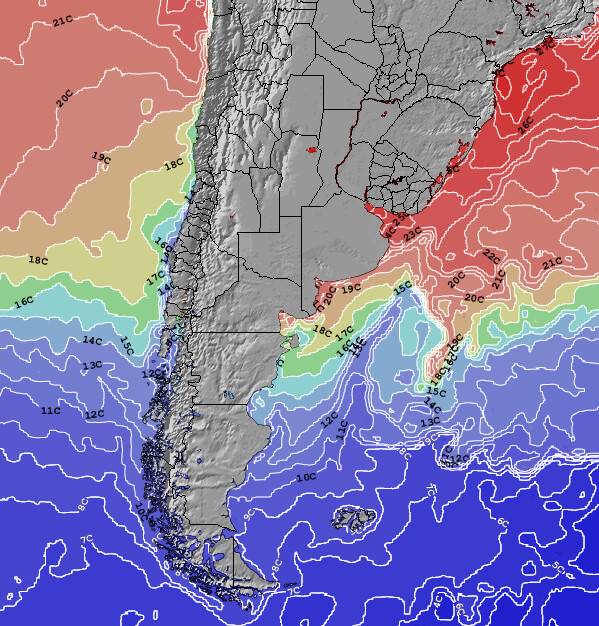 Map of current Uruguay Surface Water Temperatures (based on measurements from oceanographic satellites) | 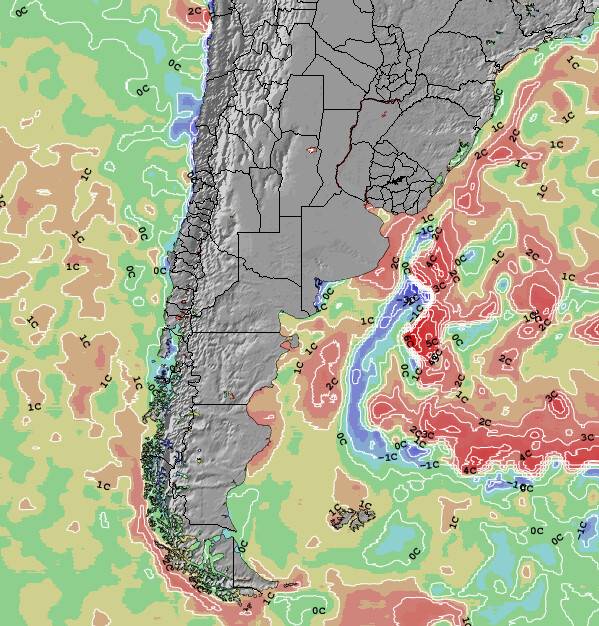 Map of current Uruguay Sea Water Temperature Anomalies (compared with long term averages at this time of year) |
click thumbnails to expand
Below is a graph of Historical Sea Surface Temperature for La Coronilla. This has been derived from analysis of two decades of oceanographic satellite measurements of nearby open water. We have calculated the average water temperature variation around the year as well as the extremes that have been observed on each date.

All of the graphs for the surf breaks presented on Surf-Forecast.com are on the same scale to enable comparison between locations around the world.
La Coronilla sea temperatures peak in the range 21 to 24°C (70 to 75°F) on around the 29th of January and are at their coldest on about the 6th of August, in the range 9 to 14°C (48 to 57°F). La Coronilla sea temperatures are always warm reach their warmest in late January. You'll need a 2mm neoprene top or a shorty at dawn/dusk or if it's windy. At its coldest in the first week of August, low sea temperatures at La Coronilla are suited to a 5/4mm or 5/3mm good quality wetsuit with neoprene gloves and 3mm boots. You will need a hood if it's windy or the air is cold.
Actual sea surface water temperatures close to shore at La Coronilla can vary by several degrees compared with these open water averages. This is especially true after heavy rain, close to river mouths or after long periods of strong offshore winds. Offshore winds cause colder deep water to replace surface water that has been warmed by the sun. Air temperature, wind-chill and sunshine should also be considered before deciding on the kind of wetsuit needed to stay warm when surfing at La Coronilla. Refer to our detailed weather forecasts for this information.
 Nearest