Nahant Beach Surf Stats
- Forecast
- Maps
- Live
- Weather State
- Spot Information
All swells
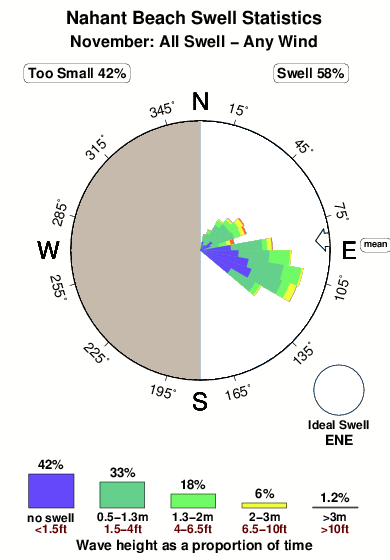


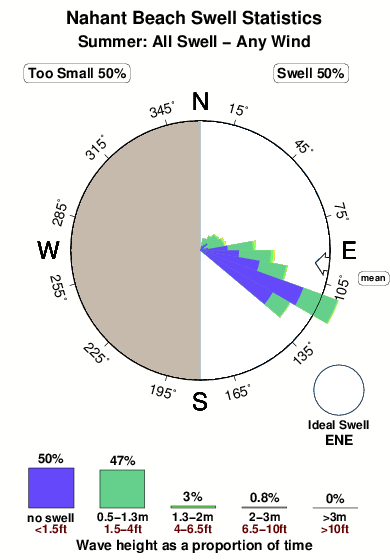
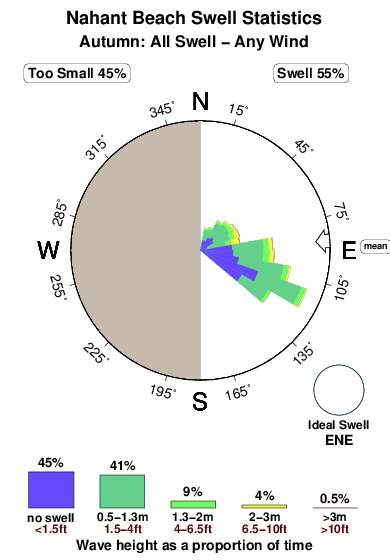
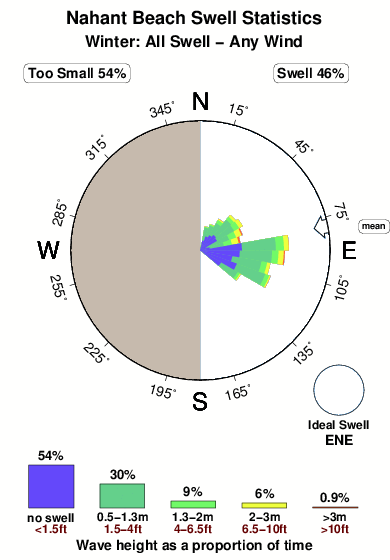
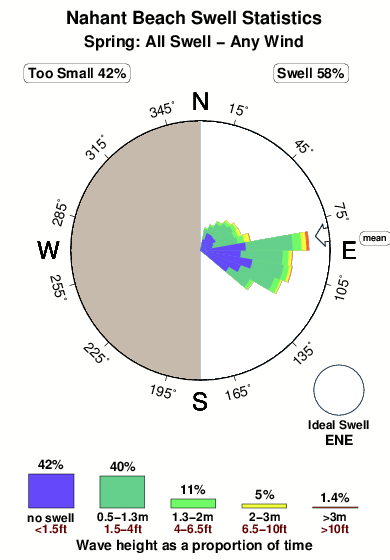
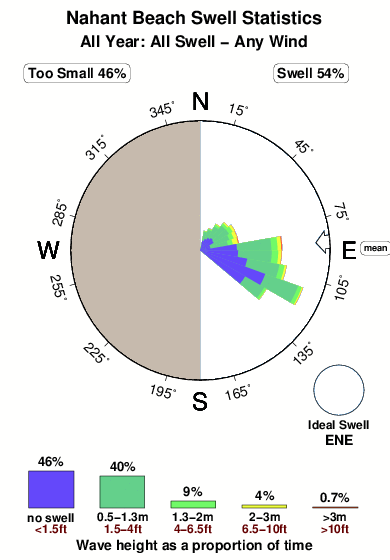
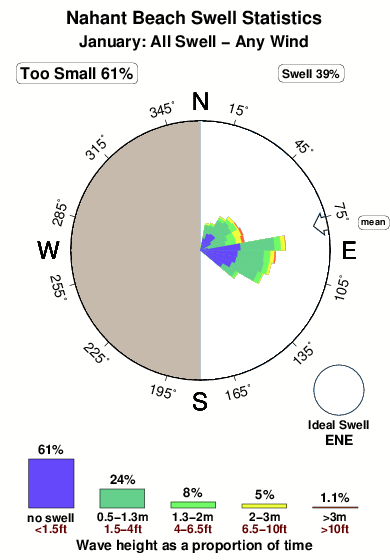
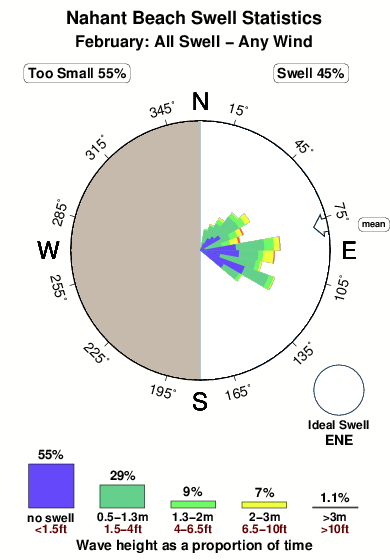
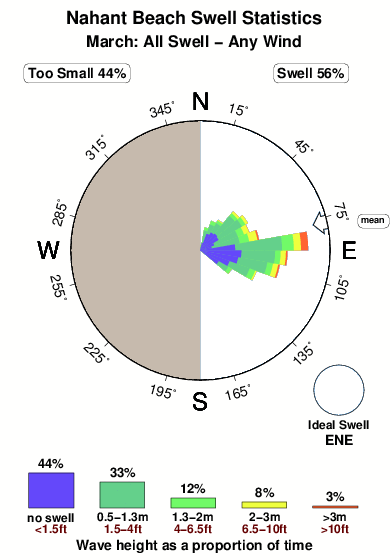
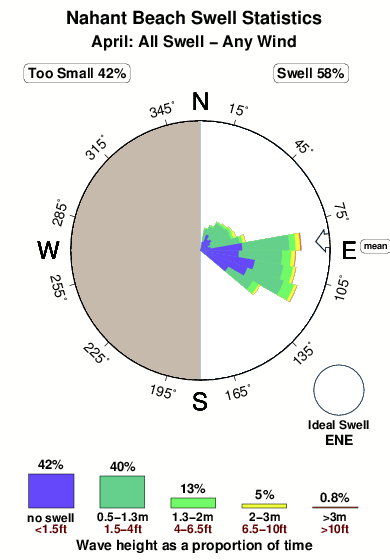
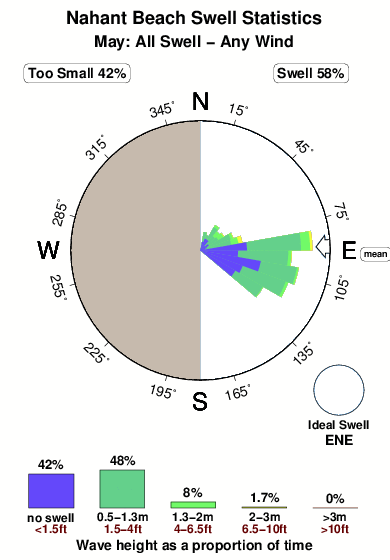
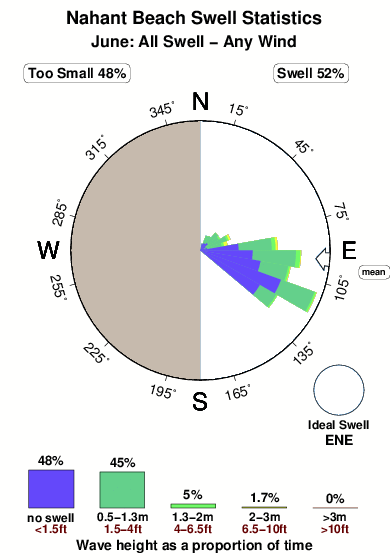
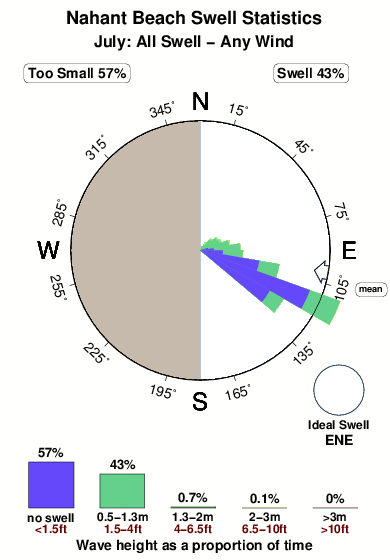
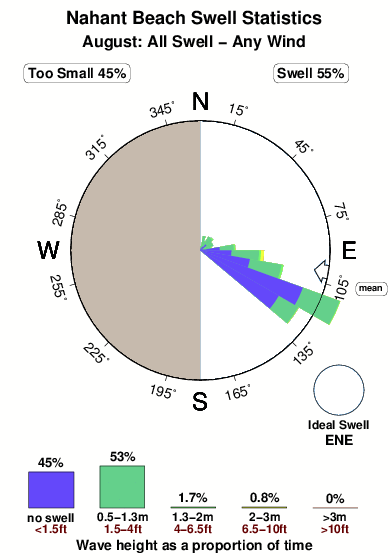
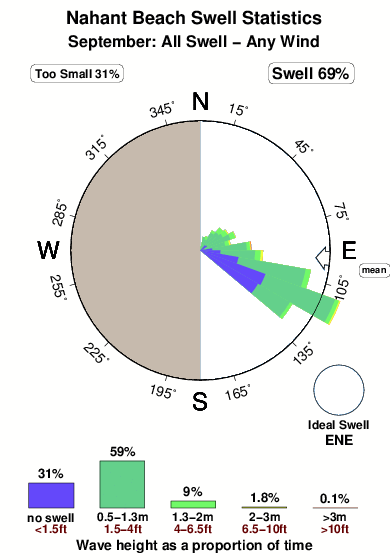
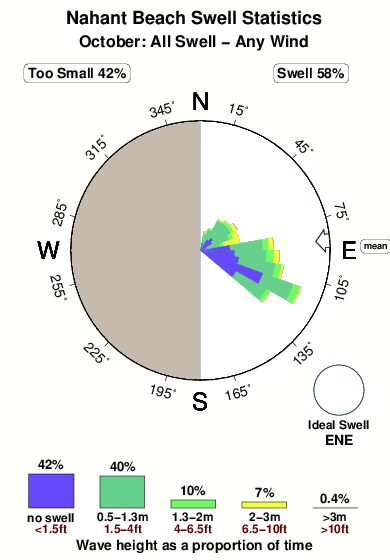
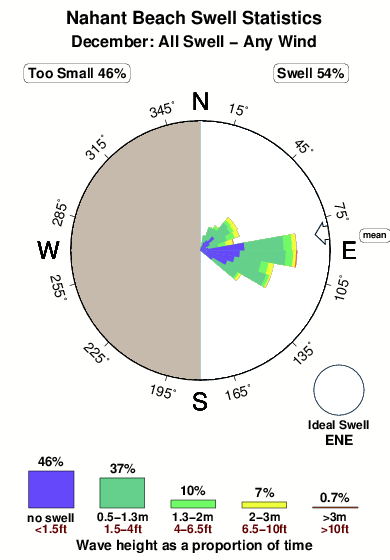
This picture illustrates the range of swells directed at Nahant Beach over a normal November, based on 2867 NWW3 model predictions since 2006 (values every 3 hours). The wave model does not forecast wind and surf right at the coastline so we have chosen the best grid node based on what we know about Nahant Beach, and at Nahant Beach the best grid node is 35 km away (22 miles). The rose diagram shows the distribution of swell directions and swell sizes, while the graph at the bottom shows the same thing but without direction information. Five colours represent increasing wave sizes. Very small swells of less than 0.5m (1.5 feet) high are shown in blue. These were forecast 42% of the time. Green and yellow show increasing swell sizes and red illustrates largest swells greater than >3m (>10ft). In each graph, the area of any colour is proportional to how commonly that size swell happens. The diagram implies that the most common swell direction, shown by the largest spokes, was E, whereas the the most common wind blows from the WNW. Because the wave model grid is away from the coast, sometimes a strong offshore wind blows largest waves away from Nahant Beach and out to sea. We lump these in with the no surf category of the bar chart. To avoid confusion we don't show these in the rose graph. Because wind determines whether or not waves are good for surfing at Nahant Beach, you can view an alternative image that shows only the swells that were expected to coincide with glassy or offshore wind conditions. During a typical November, swells large enough to cause clean enough to surf waves at Nahant Beach run for about 58% of the time.
 Nearest