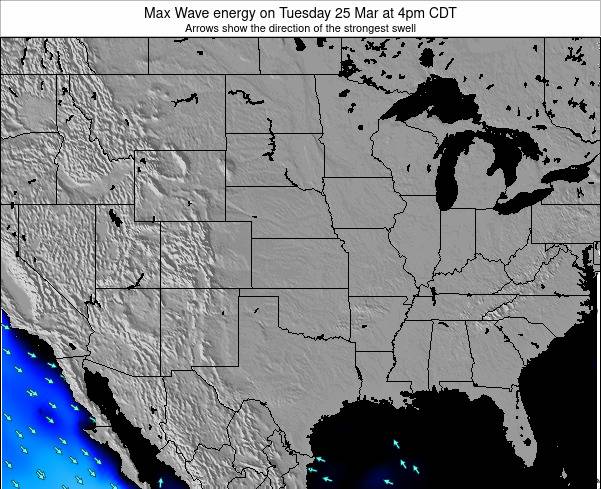
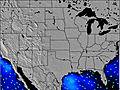
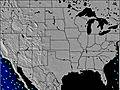
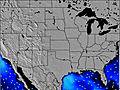
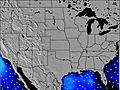
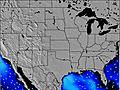
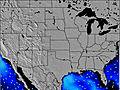
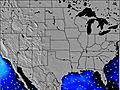
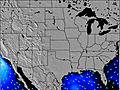
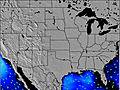
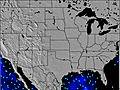
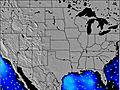
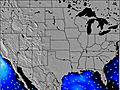
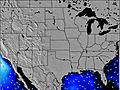
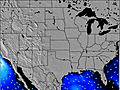
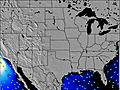
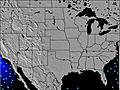
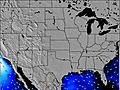
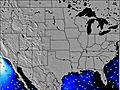
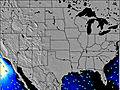
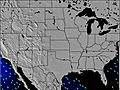
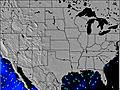
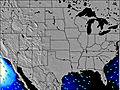
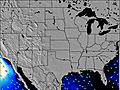
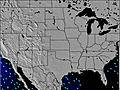
Oklahoma Weather Map
Max Wave energy on Sunday 02 Aug at 4pm CDT
Return to Static Maps | Go to Animated map
Other Periods of this Wave Energy Map:
|
|
|

|
|
|
|
|
|
|
|
|
|
|
|
|

|
|
|
|
|

|
|
|
|
|
|
|
|

|
Return to Static Maps | Go to Animated map
|
|
|
|
|
|
|
|
|
|
|
|
|
|
|
|
|
|
|
|
|
|
|
|
|
|
|
|
|
|
|
|
|
|
|
|
 Nearest