
Today's Playa Negra sea temperature is 30.2 °C
(1.6°C warmer than normal for this time of year)
| Mean: | 28.6 °C | ||||||||||||||||||||||||||||||||||||||||||||||||||||||||||||||||||||||||||||||||||||||||||||||||||
|---|---|---|---|---|---|---|---|---|---|---|---|---|---|---|---|---|---|---|---|---|---|---|---|---|---|---|---|---|---|---|---|---|---|---|---|---|---|---|---|---|---|---|---|---|---|---|---|---|---|---|---|---|---|---|---|---|---|---|---|---|---|---|---|---|---|---|---|---|---|---|---|---|---|---|---|---|---|---|---|---|---|---|---|---|---|---|---|---|---|---|---|---|---|---|---|---|---|---|---|
| Range: | 27.4 °C to 30.3 °C | ||||||||||||||||||||||||||||||||||||||||||||||||||||||||||||||||||||||||||||||||||||||||||||||||||
| Statistics for 08 Jun (1981–2005) | |||||||||||||||||||||||||||||||||||||||||||||||||||||||||||||||||||||||||||||||||||||||||||||||||||
Today, many surfers would wear a rashvest wetsuit.
Very warm air temperatures and very warm water(30 °C) too at Playa Negra, warm enough for wearing board shorts and a rash vest in the surf. Cloudy, but feeling very pleasant in and out of the water.
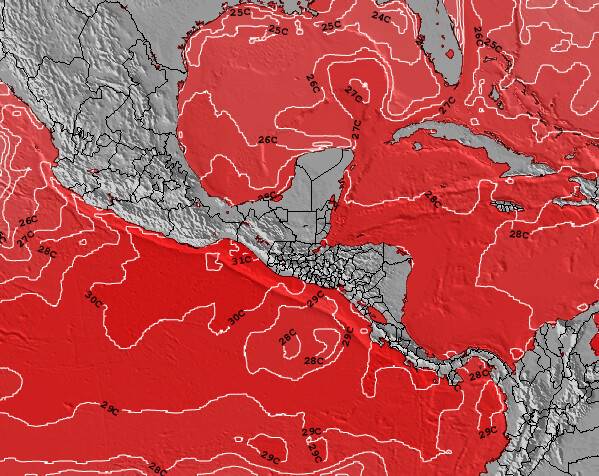 Map of current Costa Rica Surface Water Temperatures (based on measurements from oceanographic satellites) | 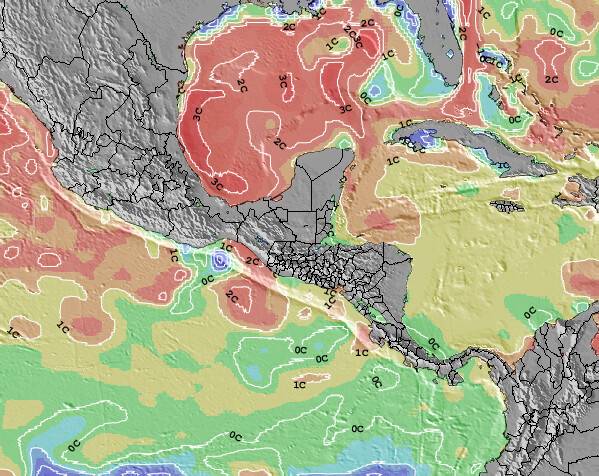 Map of current Costa Rica Sea Water Temperature Anomalies (compared with long term averages at this time of year) |
click thumbnails to expand
Below is a graph of Historical Sea Surface Temperature for Playa Negra. This has been derived from analysis of two decades of oceanographic satellite measurements of nearby open water. We have calculated the average water temperature variation around the year as well as the extremes that have been observed on each date.

All of the graphs for the surf breaks presented on Surf-Forecast.com are on the same scale to enable comparison between locations around the world.
Playa Negra water temperatures peak in the range 28 to 30°C (82 to 86°F) on around the 12th of May and are at their coldest on about the 25th of January, in the range 25 to 29°C (77 to 84°F). Year round warm water temperatures at Playa Negra mean that a rash vest and board shorts should be fine for surfing at any time of year
Actual sea surface water temperatures close to shore at Playa Negra can vary by several degrees compared with these open water averages. This is especially true after heavy rain, close to river mouths or after long periods of strong offshore winds. Offshore winds cause colder deep water to replace surface water that has been warmed by the sun. Air temperature, wind-chill and sunshine should also be considered before deciding on the kind of wetsuit needed to stay warm when surfing at Playa Negra. Refer to our detailed weather forecasts for this information.
 Nearest