
Today's North Pier (Narragansett) sea temperature is 15.7 °C
(1.1°C warmer than normal for this time of year)
| Mean: | 14.6 °C | ||||||||||||||||||||||||||||||||||||||||||||||||||||||||||||||||||||||||||||||||||||||||||||||||||
|---|---|---|---|---|---|---|---|---|---|---|---|---|---|---|---|---|---|---|---|---|---|---|---|---|---|---|---|---|---|---|---|---|---|---|---|---|---|---|---|---|---|---|---|---|---|---|---|---|---|---|---|---|---|---|---|---|---|---|---|---|---|---|---|---|---|---|---|---|---|---|---|---|---|---|---|---|---|---|---|---|---|---|---|---|---|---|---|---|---|---|---|---|---|---|---|---|---|---|---|
| Range: | 12.3 °C to 16.7 °C | ||||||||||||||||||||||||||||||||||||||||||||||||||||||||||||||||||||||||||||||||||||||||||||||||||
| Statistics for 09 Jun (1981–2005) | |||||||||||||||||||||||||||||||||||||||||||||||||||||||||||||||||||||||||||||||||||||||||||||||||||
Today, many surfers would wear a spring wetsuit.
Sunny with pleasantly warm air temperatures (feels like 21 °C) at North Pier (Narragansett), yet the sea remains several degrees colder than the air. Most surfers will need a spring wetsuit though a summer suit or even a shorty may suffice for a short session.
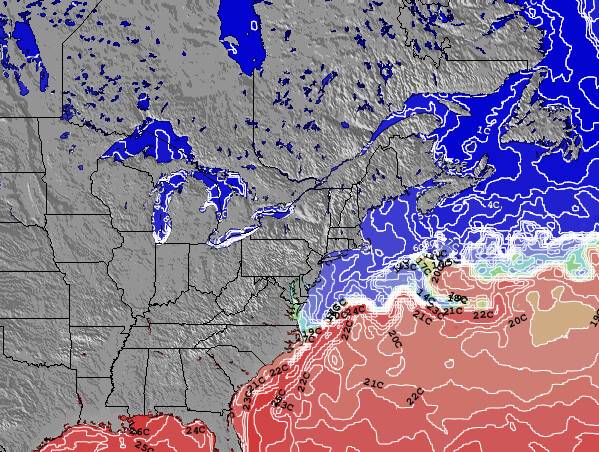 Map of current United States Surface Water Temperatures (based on measurements from oceanographic satellites) | 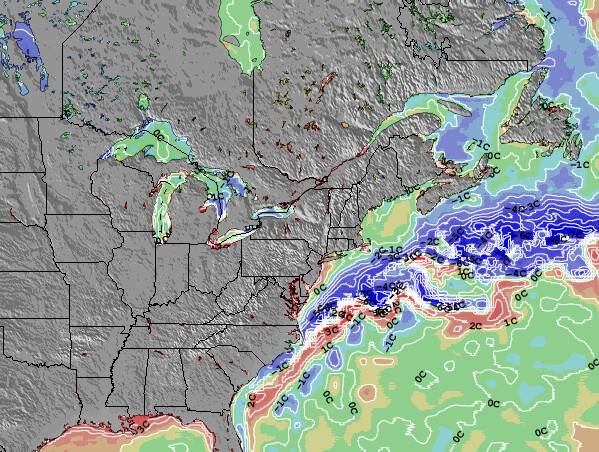 Map of current United States Sea Water Temperature Anomalies (compared with long term averages at this time of year) |
click thumbnails to expand
Below is a graph of Historical Sea Surface Temperature for North Pier (Narragansett). This has been derived from analysis of two decades of oceanographic satellite measurements of nearby open water. We have calculated the average water temperature variation around the year as well as the extremes that have been observed on each date.

All of the graphs for the surf breaks presented on Surf-Forecast.com are on the same scale to enable comparison between locations around the world.
North Pier (Narragansett) sea water temperatures peak in the range 20 to 24°C (68 to 75°F) on around the 9th of August and are at their minimum on about the 28th of February, in the range 3 to 6°C (37 to 43°F). North Pier (Narragansett) sea water temperatures are warmest in early to mid August. Surfers should use a 2mm long sleeve shorty or a 3/2mm spring wetsuit if the wind is up. The minimum sea water temperatures at North Pier (Narragansett) mean that you will need a flexible 6/5/4mm wetsuit or a well fitting 5/4mm wetsuit with gloves and 5mm neoprene booties and a hood to surf here in the fourth week of February.
Actual sea surface water temperatures close to shore at North Pier (Narragansett) can vary by several degrees compared with these open water averages. This is especially true after heavy rain, close to river mouths or after long periods of strong offshore winds. Offshore winds cause colder deep water to replace surface water that has been warmed by the sun. Air temperature, wind-chill and sunshine should also be considered before deciding on the kind of wetsuit needed to stay warm when surfing at North Pier (Narragansett). Refer to our detailed weather forecasts for this information.
 Nearest